

Visualization Tools for Geometric Deep Learning
Geometric Deep Learning / Tools & Libraries

Have you ever found it challenging to translate complex AI architectures or machine learning outcomes into a clear, compelling narrative?
Fortunately, Python offers a powerful suite of libraries specifically designed to bring these models and concepts to life through visualization and animation.
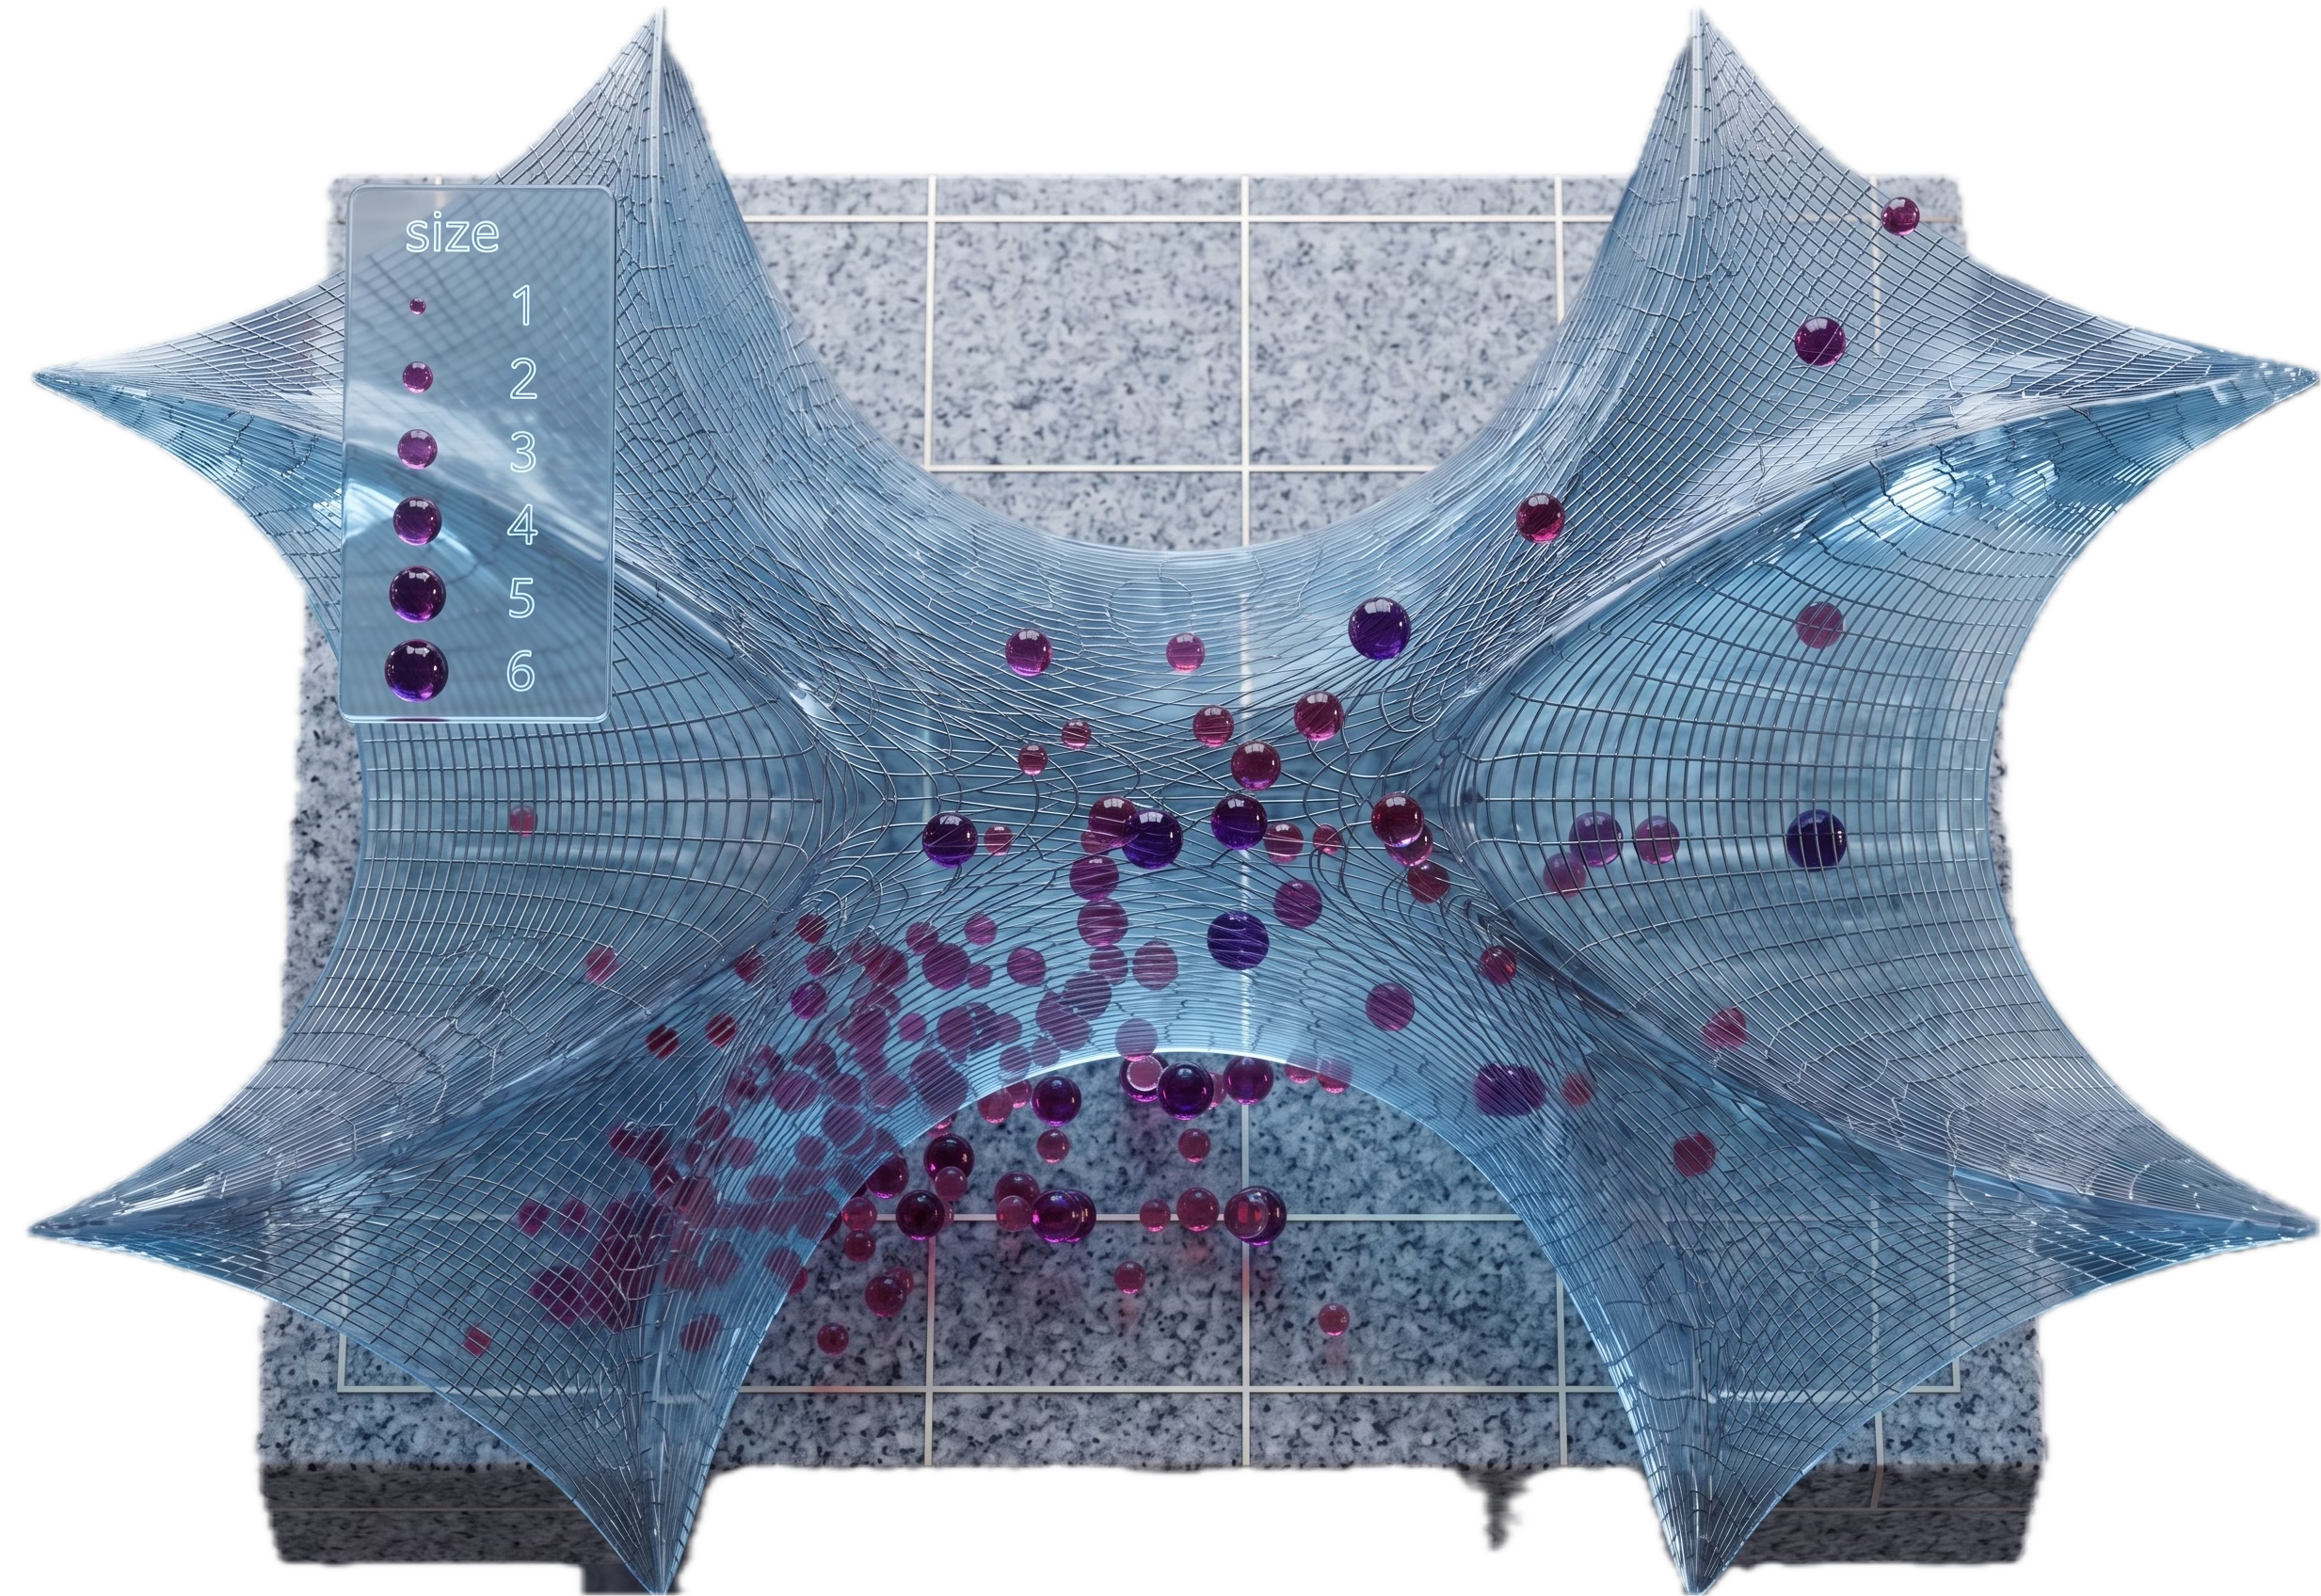
Geometric Deep Learning, World Models use complex math to overcome limitations of traditional deep learning. We make that math practical through hands-on tutorials.
Functionality
Installation
🏛️ Manim
Functionality
Installation
Animation Frameworks - Deep Dive
⚙️ Lie SE3 Euclidean Group (Matplotlib)
⚙️ Graph Convolutional Neural Network (Manim)

👉 Patrick Nicolas is a 30-year software engineering veteran and consultant specializing in Geometric Deep Learning and World Models, author of Scala for Machine Learning, and writer of Geometric Learning in Python.
Why this Matters
Purpose: Abstract mathematical frameworks, including algebraic topology and differential geometry, are often best elucidated through dynamic visualizations and animations. These tools are invaluable for both conceptual demonstrations and the interpretation of experimental results. To meet this need, the Python ecosystem offers data scientists a robust selection of specialized animation libraries.
Audience: Scientists and engineers who needs to describe their model through animation or create demos to illustrate a new concept
Value: Explore essential Python libraries as powerful communication vehicles for visualizing and animating complex models and experimental results.
Key Takeaways
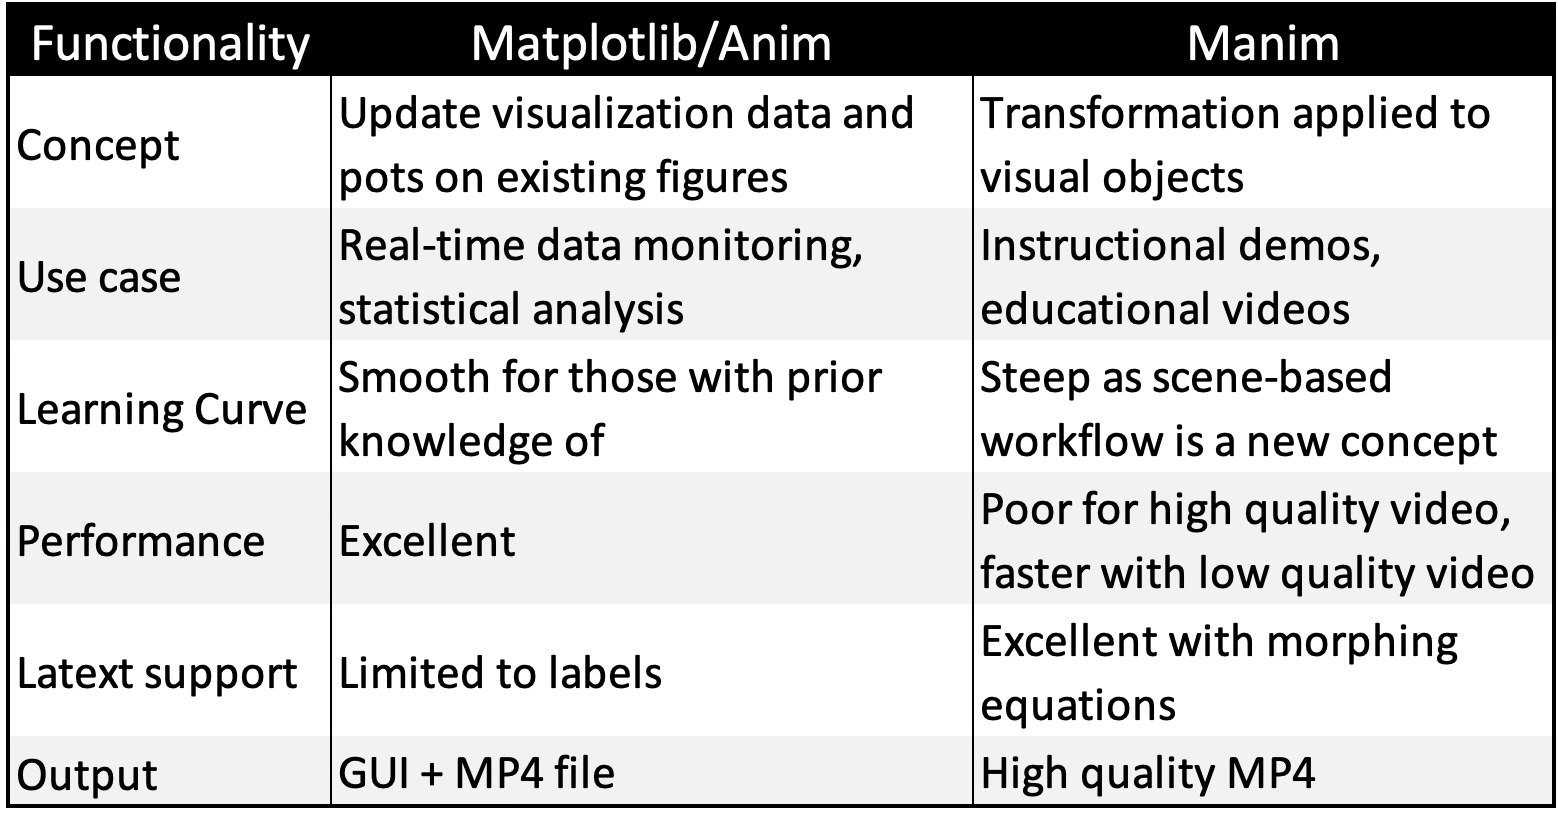
Matplotlib.animation: An accessible extension of the standard Matplotlib library, offering a gentle learning curve for those looking to add dynamic updates to existing visualizations.
Manim: A high-fidelity engine supporting complex scenes, camera controls, and LaTeX integration; however, its extensive feature set requires a significantly higher time investment to master.
Use Cases: Matplotlib excels in real-time monitoring and data analysis, whereas Manim is optimized for polished educational content, professional demonstrations, and high-quality storytelling.
Performance: Due to its rendering overhead, Manim is less efficient for large-scale sequences. It is best used with a “low-quality first” iterative workflow, scaling up to high-resolution output only for the final release.
Animation Frameworks - Basic
This section covers the essential Basics, while the Deep Dive section delivers advanced concepts, real-world applicability, dedicated Q&A and review.
📌 Although various specialized 3D rendering frameworks are available [ref 1], they are often either underutilized in research or incompatible with the requirements of geometric learning.
Matplotlib/Animation
While Matplotlib remains the industry standard for static and interactive data visualization, its animation features are frequently underutilized and less widely understood.
📌 This article focuses specifically on animation; therefore, I will not delve into Matplotlib’s standard plotting functionality.
Functionality
While often seen as “basic,” Matplotlib remains the most versatile for scientific plotting and is often the best “first step” for simple animations. It is best suited for Real-time signal processing, simple 2D dynamic systems, physics and math simulation [ref 2].
Matplotlib enables animation generation via its animation module, treating an animation as a series of individual frames plotted on a single, condensed figure.
The animation process relies on two Python classes [ref 3].
FuncAnimation that generates animation by iteratively updating the data of a single plot. It is generally the more efficient choice for memory and speed.
ArtistAnimation that creates animation from a pre-defined list of “Artist” objects (drawings) for each frame. This approach is better suited for complex or highly creative scenes.
Installation
pip install matplotlibBasic design is illustrated by the following pseudo-code
draw:
   initialize animation configuration parameters
   set up static elements
   -> update(frame)   # Nested function to update the dynamic component

   invoke FuncAnimation(fig, update, frames=100, interval=300, ...)
   save animation to MP4 file
Manim
Manim is the gold standard for high-quality, explanatory math videos. It is particularly suitable for Calculus, linear algebra, and complex equations where precise “morphing” between formulas and shapes is needed. Manim is the most commonly used animation on YouTube [ref 4].
The key features are Native LaTeX support, built-in coordinate systems, and beautiful object to object transformations.
Functionality
A Manim animation implements a dynamic scene, defined in the class Scene (or its subclasses). Objects to be displayed and/or animated in a scene have their type inheriting from the class Mobject [ref 5, 6]
Here a list of the most common objects, scenes and animation functions.
Objects
Mobject: base class for objects that can be displayed on screen.
VMobject: A vectorized Mobject
VGroup A group of vectorized objects of type VMobject
NxGraph: Generic mathematical graph
Graph: Undirected graph
DiGraph: Directed graph
ValueTracker: An object that track real-value parameters
Arc: A circular arc defined by its start and end angle (radiants)
Circle: A circular arc (0, 2.pi)
Line: A curved or straight line between 2 mobjects
Arrow: Graph configuration arrow
Text: Ascii or Latex content
Angle: A circular arc mobject defined by its angle
…
Scenes
Scene: Set of tools to manage mobject and animations
ThreeDScene: 3D scene with camera angle
SpecialThreeDScene: 3D scene with support for spheres and camera shades
The key functions for scenes are
construct: Add content mobjects or vmobjects to the scene
add: Adds a mobject
clear: Removes all objects
remove: Removes a given mobject
bring_to_front/bring_to_back: Brings mobjects in front or back in the scene
pause : Pauses the scene
play: Plays an animation in the scene
wait: Plays animation without change
Animation
Create: Shows a mobject
Write: Simulate hand-drawing or handwriting
Unwrite: Simulate the erasure of handwriting or hand-drawing mobject
FadeIn: Alternative to create by fading in an mobject into the scene
FadeOut: Fades out an mobject into the scene
Rotate: Animation that rotates an mobject in a scene
Transform: Transform one mobject to another one
…
📌 ManimGL is a separate version of Manim (by 3Blue1Brown) that uses OpenGL for hardware-accelerated, real-time rendering. If you find the standard ManimCE too slow for your complex manifolds, ManimGL might be the solution.
Installation
Installation Linux
sudo apt update
sudo apt install build-essential python3-dev libcairo2-dev
                 libpango1.0-dev ffmpeg   # Manim dependency
pip install manim
Installation MacOS
brew install manim
brew install py3cairo ffmpeg pango pkg-config scipy     # Dependencies
Installation verification
manim checkhealthInitializing a Manim project in folder ‘my_folder’
manim init project my-folder --defaultExecution of a scene - class MyScene
manim -pql main.py MyScene
ql: low quality video
qm: medium quality video
qh: high quality video
📌 Although the Seaborn library is a compelling extension to Matplotlib plotting capabilities, it does not support animation.
Which Animation Library?
Choosing between Matplotlib and Manim depends entirely on whether you are analyzing data or explaining a story. Matplotlib is built for speed and scientific rigor, while Manim is built for cinematic, educational aesthetics.
📌 Beyond Matplotlib and Manim, two additional frameworks provide the sophisticated 3D rendering capabilities required for complex tasks:
PyVista, which excels at generating 3D manifolds and intricate surface meshes [ref 7].
Plotly, which is optimized for developing interactive dashboards for real-time analysis and monitoring [ref 8]
Keep reading with a 7-day free trial
Subscribe to Hands-on Geometric Deep Learning to keep reading this post and get 7 days of free access to the full post archives.