


Exploring Geometric Learning with Geomstats

Would an intuitive Python library focused on the core principles of geometric deep learning, such as differential geometry and manifolds, be valuable to you?
Look no further—Geomstats, a library frequently featured in this newsletter, is the solution.
Table of contents
Beta Distribution on Hypersphere
🛠️ Exercises

🎯 Why this Matters
Purpose: Geomstats is used in several articles of this newsletter for its capabilities for exploring differential geometry and information geometry in the context of machine learning.
Audience: Data scientists and engineers interested in the mathematical foundations of geometric deep learning.
Value: Gain insights into core geometric learning principles, including data manifolds, metrics, tangent spaces, geodesics, and intrinsic representations, with hands-on implementation using Python and the Geomstats library.
🎨 Modeling & Design Principles
Overview
The core concept of Geomstats is to incorporate differential geometry principles, such as manifolds and Lie groups, into the development of statistical and machine learning models. This open-source, object-oriented library follows Scikit-Learn’s API conventions for seamless integration [ref 1].
Geomstats serves as a practical tool for gaining hands-on experience with geometric learning fundamentals while also supporting future research in the field.
Quick Tutorial
This article focuses on the following 3 Geomstats modules:
geometry
information geometry
learning
This newsletter relies on several key Python libraries to build Geometric Deep Learning applications as illustrated below:
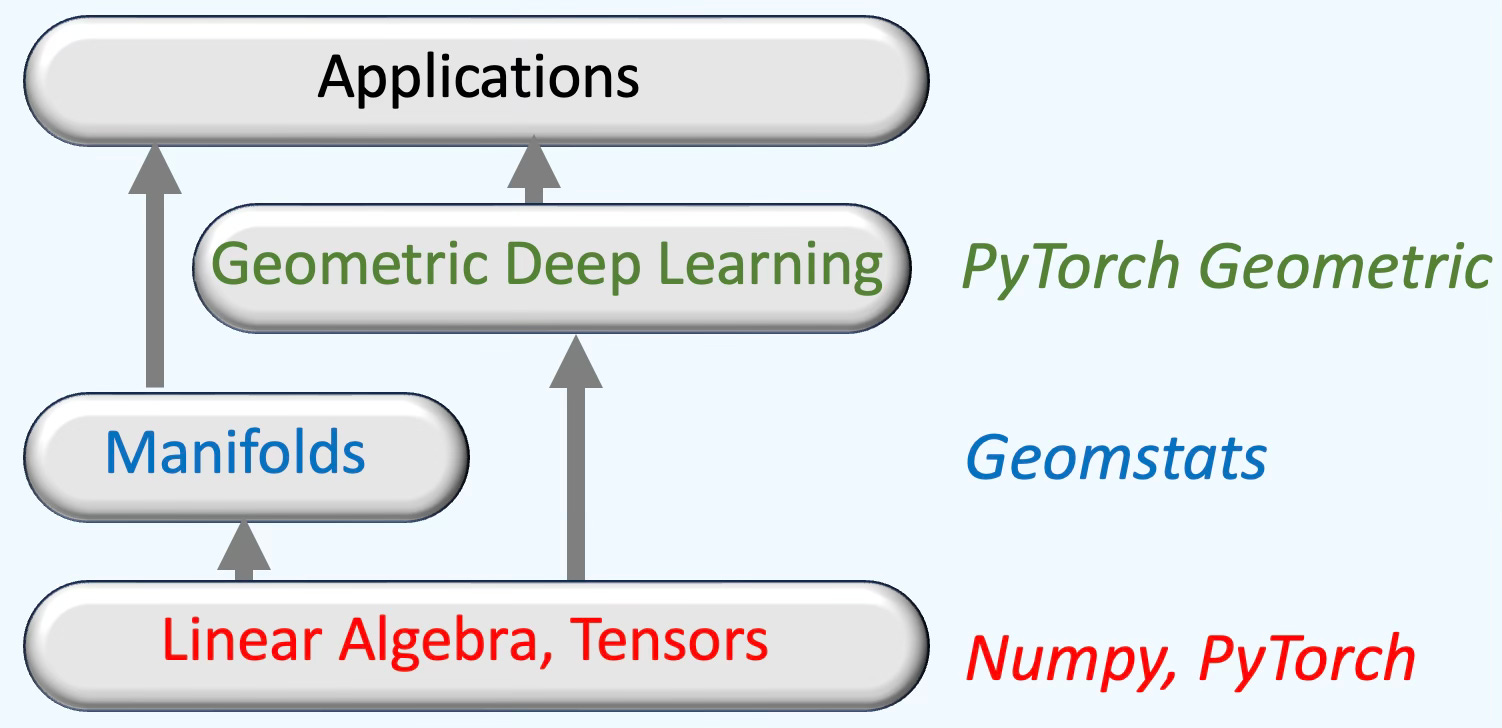
Fig 1. Sketch of key Python libraries using in Geometric Deep Learning
📌 Readers familiar with the fundamental concepts of differential geometry may proceed directly to the Evaluation section.
Mathematical Concepts
Before diving into Geomstats internals [ref 2], let’s review some basic concepts of differential geometry and manifolds.
Differential Geometry
Differential geometry is a branch of mathematics that uses techniques from calculus, algebra and topology to study the properties of curves, surfaces, and higher-dimensional objects in space. It focuses on concepts such as curvature, angles, and distances, examining how these properties vary as one moves along different paths on a geometric object [ref 3].
Differential geometry is crucial in understanding the shapes and structures of objects that can be continuously altered, and it has applications in many fields including physics (i.e., general relativity and quantum mechanics), engineering, computer science, and data exploration and analysis [ref 4].
Riemannian Manifolds
A manifold is essentially a space that, around every point, looks like Euclidean space, created from a collection of maps (or charts) called an atlas, which belongs to Euclidean space. Smooth or Differential manifolds have atangent space at each point, consisting of vectors. Riemannian manifolds are a type of differential manifold equipped with a metric to measure curvature, gradient, and divergence.
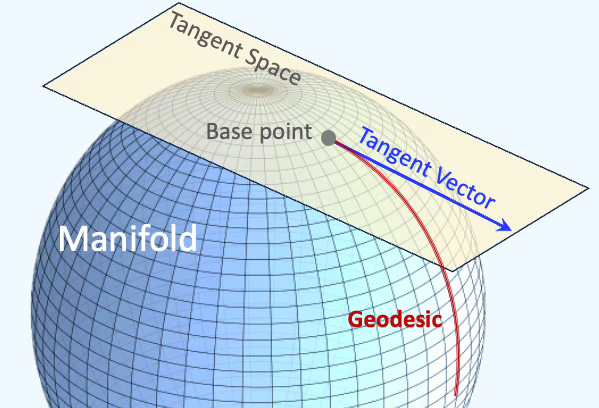
Fig 2. Visualization of key components of a spherical manifold
In deep learning, the manifolds of interest are typically Riemannian due to these properties.
The manifold hypothesis states that real-world high-dimensional data lie on low-dimensional manifolds embedded within the high-dimensional space.
Studying data that reside on manifolds can often be done without the need for Riemannian Geometry, yet opting to perform data analysis on manifolds presents three key advantages [ref 5]:
By analyzing data directly on its residing manifold, you can simplify the system by reducing its degrees of freedom. This simplification not only makes calculations easier but also results in findings that are more straightforward to understand and interpret.
Understanding the specific manifold to which a dataset belongs enhances your comprehension of how the data evolves over time.
Being aware of the manifold on which a dataset exists enhances your ability to predict future data points. This knowledge allows for more effective signal extraction from datasets that are either noisy or contain limited data points.
Use case: Hypersphere
The hypersphere is a frequently utilized manifold that can be conveniently visualized in a 3D plot. An hypersphere S of dimension d, embedded in an Euclidean space d+1 is defined as:
📌 The hypersphere appears in numerous articles within this newsletter.
Information Geometry
Information geometry is a field that combines ideas from differential geometry and information theory to study the geometric structure of probability distributions and statistical models. It focuses on the way information can be quantified, manipulated, and interpreted geometrically, exploring concepts like distance and curvature within the space of probability distributions.
This approach provides a powerful framework for understanding complex statistical models and the relationships between them, making it applicable in areas such as machine learning, signal processing, and more.
Use case: Beta distribution on a manifold
Using a Beta distribution on a manifold offers several benefits, particularly in probabilistic modeling, Bayesian inference, and geometric deep learning. Here are the key advantages [ref 7]:
The Beta distribution is a versatile prior for modeling probabilities as it can represent probability densities over curved spaces.
Many real-world datasets lie on non-Euclidean spaces (e.g., hyperspheres, hyperbolic spaces).
The Beta distribution adapted to a manifold respects its intrinsic curvature, allowing for more realistic modeling of data distributions.
In geometric deep learning, imposing a Beta distribution on a manifold can help with regularization, preventing overfitting by constraining samples to valid regions.
The Beta distribution provides a smooth interpolation between different probability densities on a manifold.
It is commonly used in latent variable models, graph neural networks, and topological data analysis for applications such as modeling pose estimation, shape analysis, and protein folding, where data naturally resides on manifolds.
Lie Groups
Lie groups play a crucial role in Geometric Deep Learning by modeling symmetries such as rotation, translation, and scaling.
In differential geometry, a Lie group is a mathematical structure that combines the properties of both a group and a smooth manifold. It allows for the application of both algebraic and geometric techniques. As a group, it has an operation (like multiplication) that satisfies certain axioms (closure, associativity, identity, and invertibility)[ref 8].
Lie groups have widespread applications across multiple domains, including physics, robotics, control theory, computer vision, optimization, reinforcement learning, and, notably, geometric deep learning.
Use case: Symmetric positive definite (SPD) manifolds
One of commonly used Lie group is the symmetric positive definite (SPD) matrices.
SPD matrices are used in a wide range of applications. [ref 9]:
Diffusion tensor imaging (analysis of diffusion of molecules and proteins)
Brain connectivity
Dimension reduction through kernels
Robotics and dynamic systems
Multivariate principal component analysis
Spectral analysis and signal reconstruction
Partial differential equations numerical methods
Financial risk management.
A square matrix A is symmetric if it is identical to its transpose. are the entries of A. This implies that A can be fully described by its upper triangular elements.
Use case: Special Orthogonal group
The Special Orthogonal Group in 3 dimensions, SO(3) is the group of all rotation matrices in 3 spatial dimensions [ref 9]. Its mathematical definition is
It can be defined by 3 rotation elements for each of the axis of rotation x, y, and z.
Machine Learning on Manifolds
The effectiveness of many learning models greatly depends on how the data is represented, such as the impact of z-normalization on predictors. Representation Learning is the technique in machine learning that identifies and utilizes meaningful patterns from raw data, creating more accessible and manageable representations. Deep neural networks, as models of representation learning, typically transform and encode information into a different subspace.
In contrast, differential geometry focuses on developing constructs that remain consistent regardless of the data representation method. It gives us a way to construct objects which are intrinsic to the manifold itself.
Use case: Logistic Regression on SPD matrices
Let's review the ubiquitous binary logistic regression. For a set of two classes C = {0, 1} the probability of predicting the correct class given a feature set x and a model weights w is defined by sigmoid, sigm transform:
The binary classifier is then defined as
📈 Evaluation
We select few features of the Geomstats library to highlight its breath in covering differential geometry and supporting geometric deep learning. As we explore geometric deep learning more in details in future article, you will have the opportunity to discovery more of Geomstats hidden gems
Setup
Installation on Mac/Linux (Pip):
pip3 install geomstatsInstallation on Mac/Linux (Conda):
conda install -c conda-forge geomstatsInstallation GitHub:
git clone https://github.com/geomstats/geomstats.git
cd geomstats
pip3 install .
Hypersphere Tangent Space
The hypersphere is a widely used manifold that offers the advantage of being easily visualized in a 3D plot.
The initial step is to generate data on a hypersphere using the Geomstats geometry module (code snippet 1).
Output: samples
[[ 0.60000205 -0.1670153   0.78237039]
 [ 0.97717133 -0.15023209 -0.15022156]
 [ 0.86889694  0.42224942 -0.25830898]
 ....
Next we compute the tangent vector and end points as illustrated below:
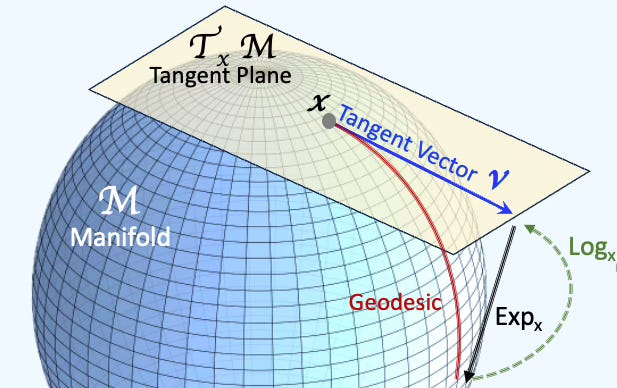
Fig. 3 Illustration of Tangent Space, Geodesic, exponential and logarithm maps
We need to specify the back-end used by the Geomstats in order to compute the tangent vector and end_point along the geodesic. The steps are
Generate a 3D (directional) vector using Numpy back-end
Generate the tangent vector, tangent_vec given a base point on a manifold and the vector (direction)
Select the appropriate metric, HypersphereMetric
Compute the end_point on the geodesic using the exponential map
Code snippet 2:
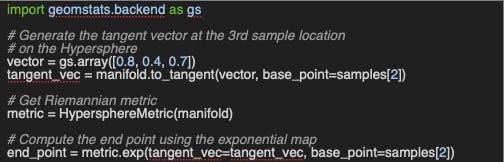
Output: tangent_vec
[0.20636871 0.11151876 0.87647696]
Output: end_point
[0.7143124  0.35688036 0.60199187]
Lastly, let’s visualize the tangent vectors, tgt_vec and data samples on the hypersphere given a directional vector and a base point (code snippet 3).
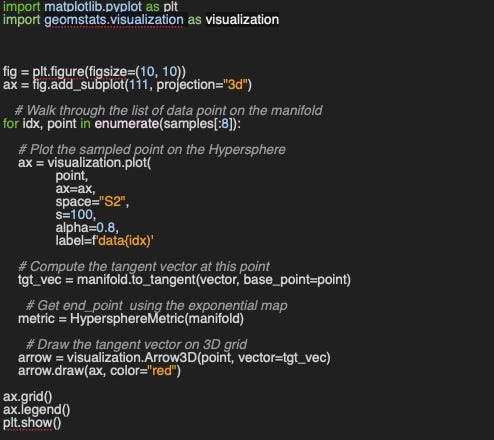
We can now, plots the 8 random point on the hypersphere with their associated tangent vectors.
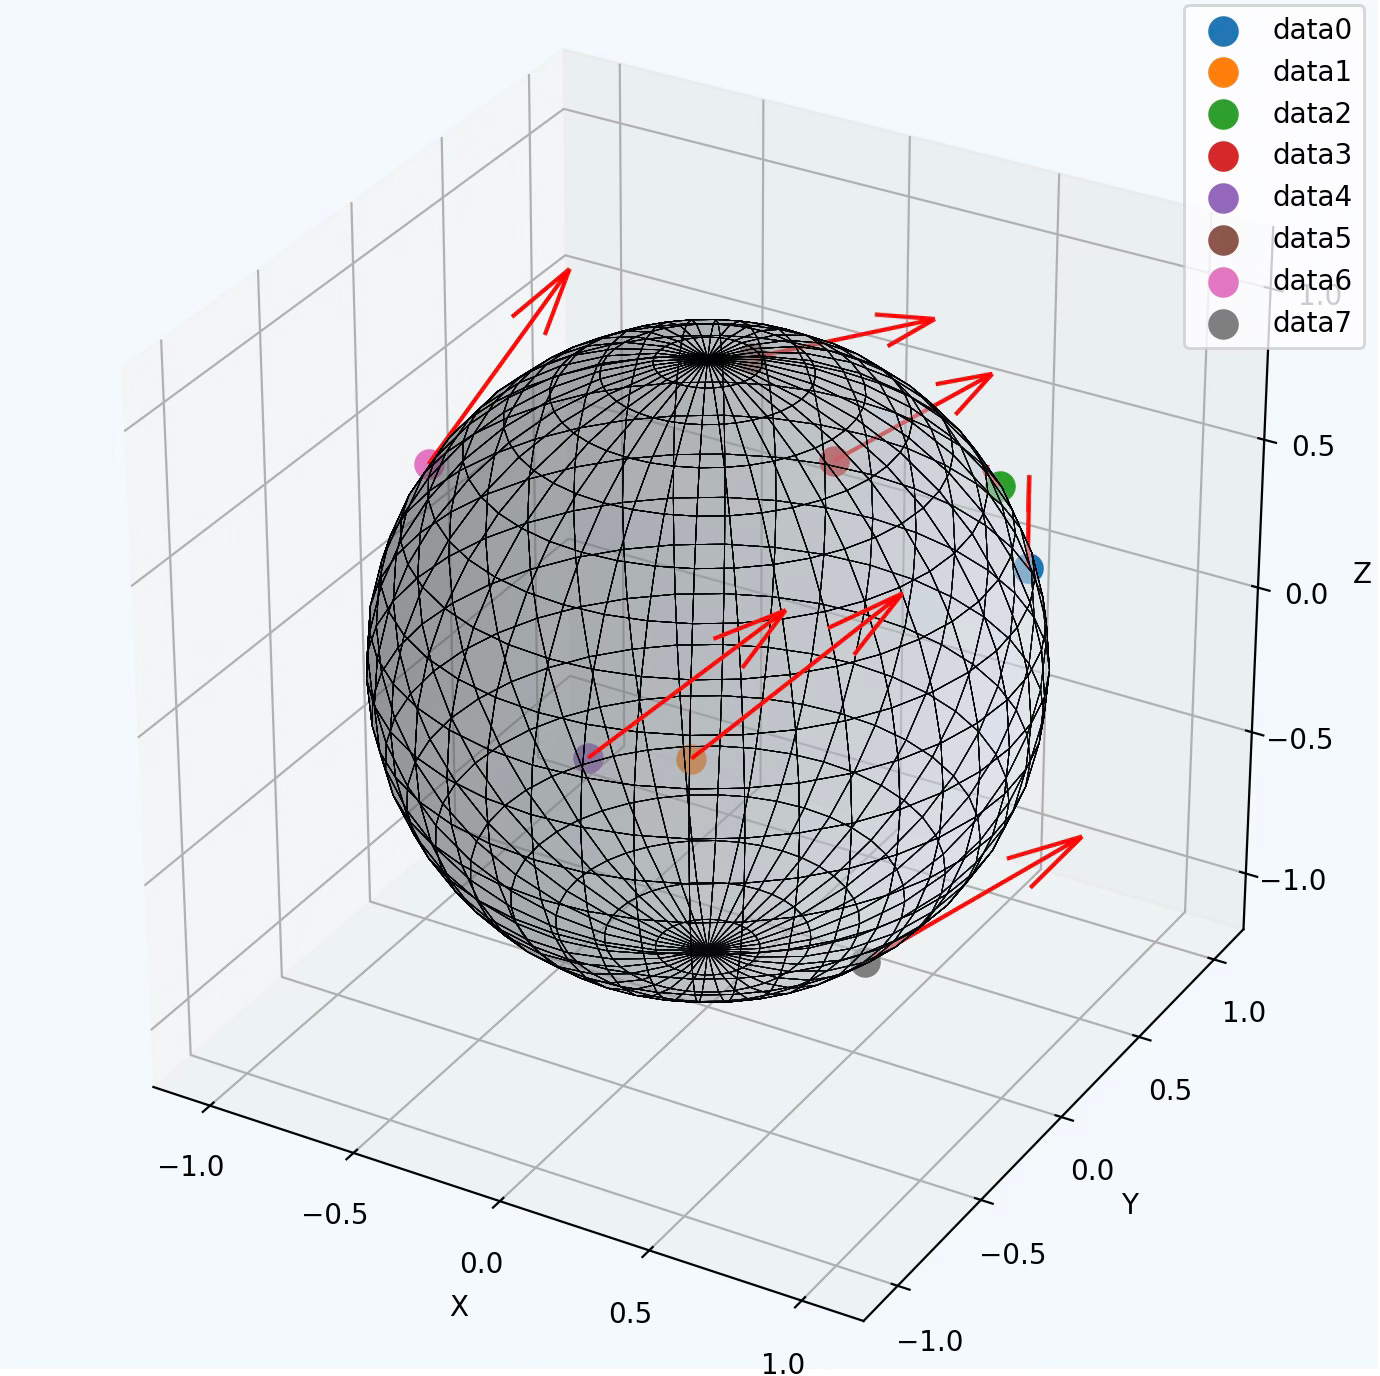
Fig. 4 Illustration of data points and tangent vectors on a Hypersphere
Beta Distribution on Hypersphere
The objective of this evaluation is to generate a manifold of Beta distribution in 2 dimension. The most important method is point_to_pdf that generate a probability density function of the beta distribution at a given point on a hypersphere (code snippet 4).
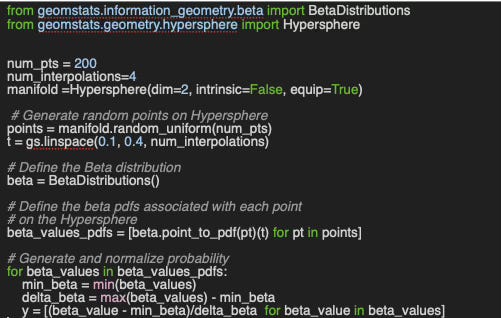
Output: y
[1.0000, 0.1932, 0.0000, 0.0098]
[1.0000, 0.2391, 0.0564, 0.0000]
[1.0000, 0.2503, 0.0629, 0.0000]
Logistic Regression on SPD Manifolds
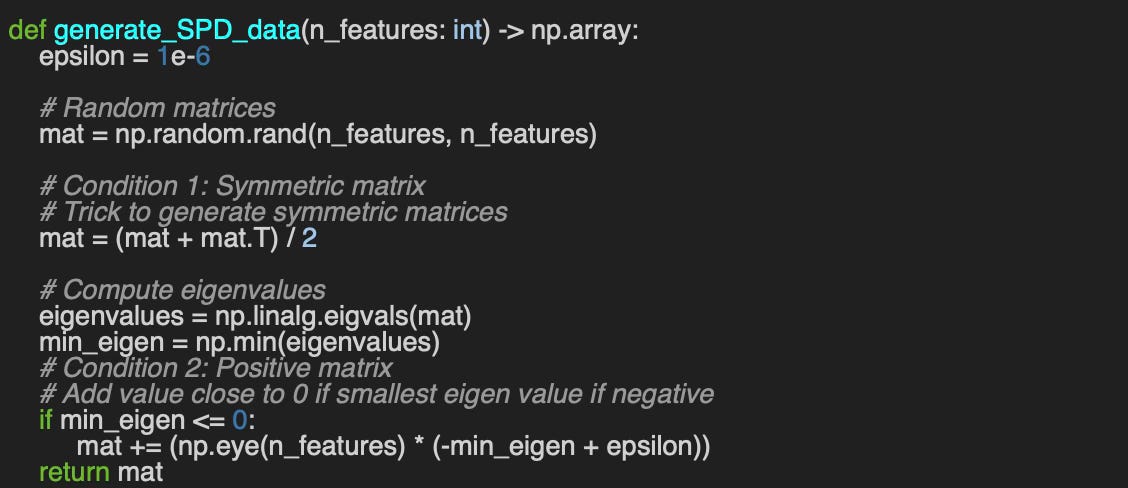
The first step is to generate a set of random Symmetric Positive Define (SPD) matrix on a hypersphere following the steps:
Create a random matrix
Make the matrix symmetric
Compute the eigenvalues of the matrix
Adjust to have all eigenvalues positive
These 4 steps are implemented in the following code snippet 5.
Let’s train and evaluate our logistic regression on tangent space of the SPD manifolds with 600 samples (code snippet 6).
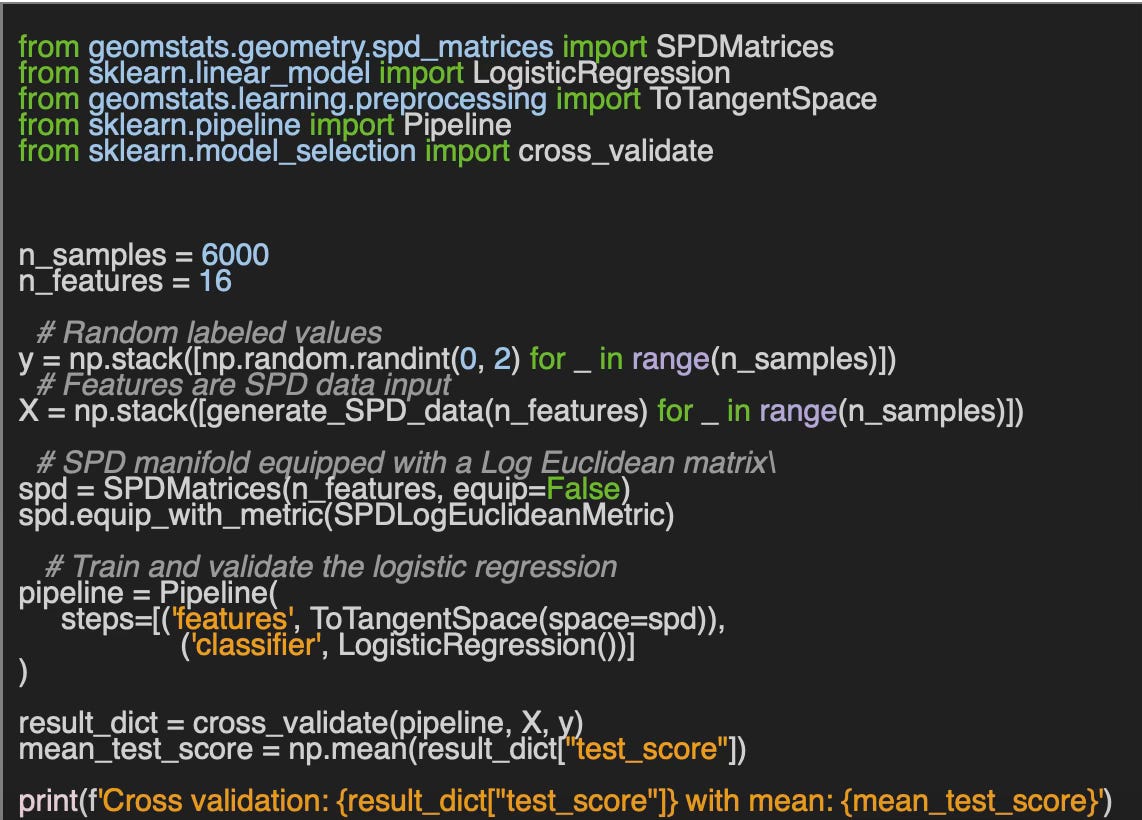
Cross validation: [0.495 0.504 0.498 0.491 0.470]
with mean: 0.492
The mean for the uniform random data should be 0.5.
Special Orthogonal (3D rotation) Lie group
We restrict our exploration of Lie group support in Geomstats to computing the endpoint on the SO(3) manifold, given a base point and a 90-degree rotation around the X-axis as the tangent vector (code snippet 7).
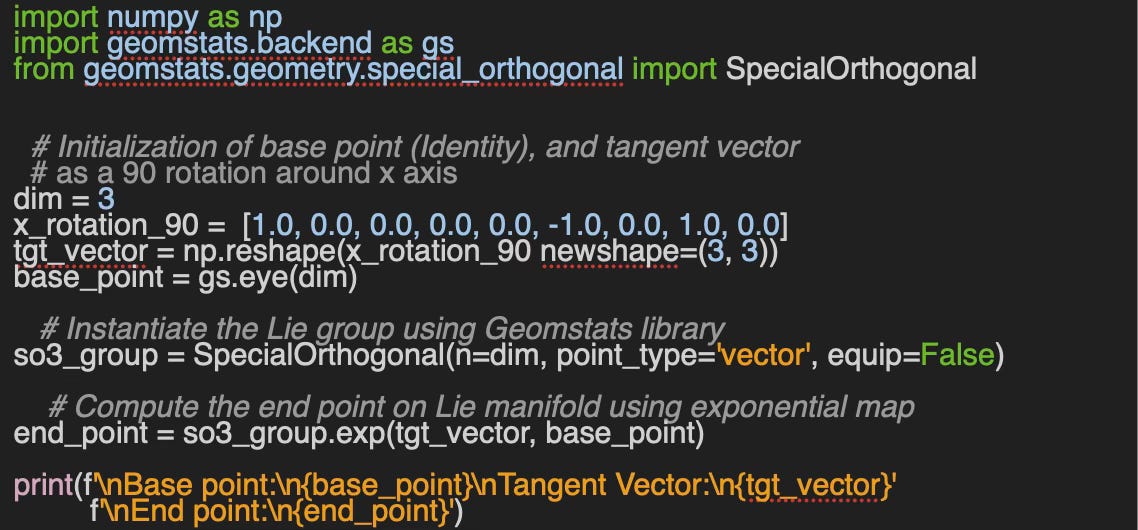
Output
Base point:
[[1. 0. 0.]
 [0. 1. 0.]
 [0. 0. 1.]]
Tangent vector:
[[ 1.  0.  0.]
 [ 0.  0. -1.]
 [ 0.  1.  0.]]
End point on SO3
[[ 2.0000 0.0000  0.0000]
 [ 0.0000 0.9196 -0.9972]
 [ 0.0000 0.9972  0.9196]]
We use a 90-degree rotation around the Z-axis as the tangent vector for the second test
Base point:
[[1. 0. 0.]
 [0. 1. 0.]
 [0. 0. 1.]]
Tangent vector:
[[ 0. -1.  0.]
 [ 1.  0.  0.]
 [ 0.  0.  1.]]
End point on SO3:
[[ 0.9196 -0.9972  0.000]
 [ 0.9972  0.9196  0.000]
 [ 0.0000  0.0000  2.000]]
🧠 Key Takeaways
✅ The Geomstats library equips data scientists with differential geometry tools, including manifolds and Lie groups, to facilitate the development of nonlinear statistical and machine learning models.
✅ Data scientists can begin exploring Geometric Deep Learning using Geomstats' data generation classes, eliminating the need to locate, load, and preprocess domain-specific datasets.
✅ The Hypersphere is particularly well-suited for learning how to integrate manifolds into machine learning models, as it supports visualization in lower dimensions, making it more intuitive for analysis and experimentation.
📘 References
geomstats: a Python Package for Riemannian Geometry in Machine Learning N. Miolane, J. Mathe, C. Donnat, M. Jorda, X. Pennec
Introduction to Differential Geometry J. Robbin, D Salamon - ETH Zurich
Riemannian Manifolds: 1 Foundation P. Nicolas
Information Geometry: Near Randomness and Near Independence -
K. Arvin, CT Dodson - Springer-Verlag 2008
Introduction to Lie groups and Lie algebras A. Kirillov, Jr. - Dept. of Mathematics, SUNY at Stony Brook
Basics of Classical Lie Groups: The Exponential Map, Lie Groups, and Lie Algebras
🛠️ Exercises
Q1: What are the advantages of using a Beta distribution on a manifold?
Q2: What is the role of the exponential map in differential geometry?
Q3: Which Geomstats method computes the tangent vector on a manifold, given a base point and a directional vector?
Q4: How does decreasing the number of samples (n_samples) from 6000 to 1000 affect the cross validation on logistic regression on SP3 manifold (code snippet 6)?
Q5: Can you implement geodesic computation using the HypersphereMetric geodesic method in Geomstats?
Q6: What will be the resulting endpoint on the SO(3) Lie group if the tangent vector represents a 90-degree rotation around the Y-axis?'
👉 Answers
💬 News and Reviews
This section focuses on news and reviews of papers pertaining to geometric deep learning and its related disciplines.
Paper review: Introduction to Geometric Learning in Python with Geomstats N. Miolane et all
Linear models sometimes fall short when dealing with high-dimensional data found in areas like computer vision, molecular biology, or radar signal processing. This type of data typically exists on curved, differentiable vector spaces, known as manifolds. Training and validating models with manifold data necessitates the use of differential geometry.
The paper highlights Geomstats, an open-source Python toolkit for handling data on non-linear manifolds. Included in the package are tutorials that combine theoretical concepts with practical Python implementations, such as:
Statistics and Geometric Statistics, demonstrated through hypersphere and Frechet mean examples.
Techniques for managing Data on Manifolds, utilizing the exponential map (tangent vector) and the Riemann Tensor metric.
·Classifying Symmetric Positive Definite matrices, which allows for the application of standard learning algorithms, like the K-Nearest Neighbors classifier, to non-linear manifolds.
Graph representations that involve embeddings in hyperbolic spaces.
This paper serves as an ideal entry point into the world of manifold learning, offering an easy-to-understand overview without requiring deep expertise in differential geometry.
Patrick Nicolas has over 25 years of experience in software and data engineering, architecture design and end-to-end deployment and support with extensive knowledge in machine learning.
He has been director of data engineering at Aideo Technologies since 2017 and he is the author of "Scala for Machine Learning", Packt Publishing ISBN 978-1-78712-238-3 and Geometric Learning in Python Newsletter on LinkedIn.