


Quiz Yourself on Geometric Deep Learning

Got questions? We’ve got 170+ sharp answers—so far!
And we’re just getting started... new ones drop regularly!

Table of Contents
⚠️ This Q&A does not aim to provide a comprehensive overview of Geometric Deep Learning. Advanced areas like Quantum Learning are beyond its scope. The organization of topics in the table of contents is somewhat subjective, as several questions intersect multiple domains.
Q: What is Geometric Deep Learning?
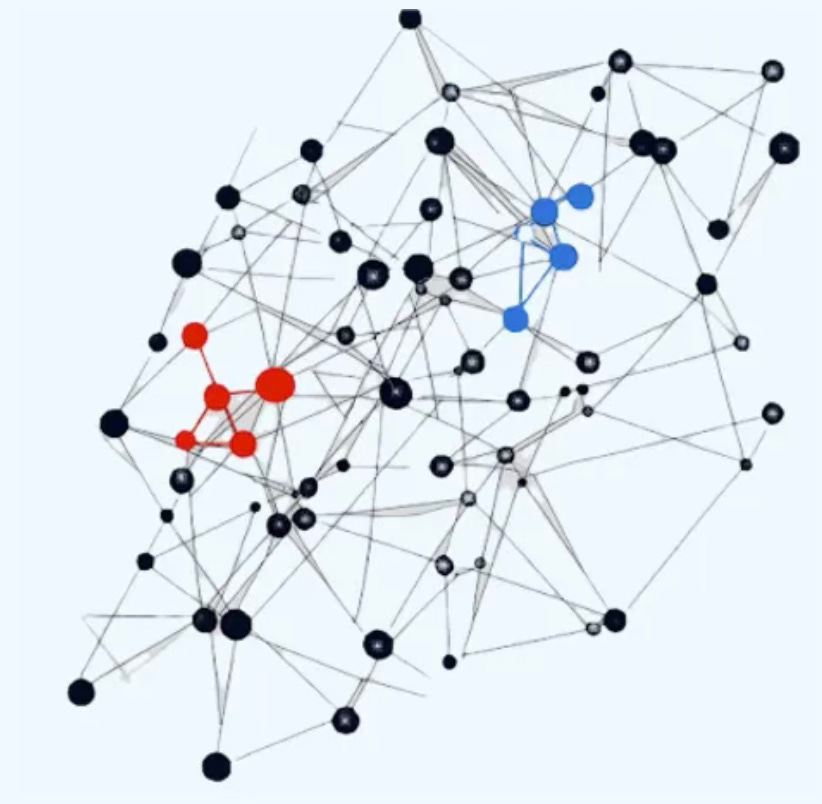
A: Geometric Deep Learning (GDL) is a field of machine learning that generalizes deep learning to non-Euclidean domains—such as graphs, manifolds, groups, and other structured geometric spaces—by leveraging their symmetries and topologies.
The key concepts are:
Invariance: Output stays the same when input is transformed
Equivariance: Preserves transformations. The output transforms predictably when input is transformed
Manifolds: Operates directly on Non-euclidean or curved spaces or tangent spaces
Locality: Uses local node structures and infinitesimal neighborhoods.
Traditional deep learning works well on Euclidean data (grids, images, sequences), but many real-world problems involve data with more complex structures such as
Physical models => Lie groups
Molecules => Manifolds
Proteins generation => Graph Neural Networks
Social networks => Graph Neural Networks
Probability distributions => Statistical manifolds
Fluid Dynamics => Manifolds, Neural operators
Cosmology => Lie groups
Robotics => Lie groups
Computer vision => Mesh, Manifolds
Q: Which tutorial and training material would you recommend to learn about Geometric Deep Learning?
A: This list if far from being exhaustive:
Geometric deep learning: going beyond Euclidean data M. Bronstein, J. Bruna, Y. LeCun, A. Szlam, P. Vadergheynst - 2017
Geometric Deep Learning Grids, Groups, Graphs, Geodesics, and Gauges M. Bronstein, J. Bruna, T Cohen, P. Veličković - 2021
Theory of Graph Neural Networks: Representation and Learning S Jegelka, Dept. of EECS and CSAIL, MIT, 2022
AMMI 2022 Course "Geometric Deep Learning" Lectures 1 to 12 M. Bronstein, J. Bruna, T Cohen, P. Veličković - YouTube - 2022
AMMI Geometric Deep Learning Seminars: Physics-based GNN F. Di Giovanni, Subgraphs GNN, F. Fasca, Equivariance in ML G. Williamson, Neural Sheaf Diffusion C. Bodar, AlphaFold R. Bates - 2022
Topological Deep Learning: Going Beyond Graph Data M Hajij et All - 2023
A Brief Introduction to Geometric Deep Learning - J. McEwen, Medium - 2023
A Hands-on Introduction to Geometric Deep Learning, with Examples in PyTorch Geometric - G. Santin, A minitutorial at the SIAM Conference on Computational Science and Engineering, 2023
Michael Bronstein - Geometric Deep Learning EEML Community - YouTube - 2024
Introduction to Geometric Deep Learning Patrick Nicolas Substack - 2025
Q: What is a signal in Geometric Deep learning?
A: A signal x is a function from a domain to a vector space whose dimensions are called channels. The space X of C-values signals is defined as:
Examples
For images the domain is the grid of pixels, and the vector is RGB of each pixel
For molecule, the domain is a graph of atoms, and the vector is the property of each atom.
Q: What is a symmetry in the context of Geometric Deep Learning?
A: A symmetry of an object is a transformation of that object that leaves it unchanged such as a triangle.
There are several types of symmetries, among them:
Symmetry of parameterization: If X is input space Y label space and W the weight space, the neural network f and the symmetry g are defined as
Symmetries of structured domains: Here are some examples
Permutation of the elements of a set preserve set membership
Rotation, translation, reflection preserves distances (Euclidean isometries)
General diffeomorphisms.
Q: What are Geometric Diffusion Models?
A: Although generative diffusion models are not strictly part of geometric deep learning, they are extendable to geometric domains, where data is defined on manifolds, graphs, or Lie groups. This gives rise to geometric diffusion models, which blend ideas from GDL and generative modeling.
A generative diffusion model is a type of probabilistic generative model that learns to generate data (like images, molecules, or 3D shapes) by simulating a reversible diffusion process. These models are particularly powerful for generating high-dimensional, complex data with remarkable quality and diversity.
Graph Neural Networks

Q: What are Graph Neural Networks?
A: Graph Neural Networks (GNNs) are a class of deep learning models designed to operate directly on graph-structured data. Unlike standard neural networks that work on fixed-size vectors or grids (like images or sequences), GNNs handle data where relationships are represented as nodes and edges—like social networks, molecules, recommendation systems, and more.
Q: Can you name five different types of Graph Neural Networks?
A: The list is far from exhaustive, but as of January 2025, the popular models in research papers are: Graph Convolutional Networks, Graph Attention Networks, GraphSAGE, Spectral Graph Neural Networks, Graph Transformers.
Q: What are the 3 level of tasks in Graph Neural Networks?
A: Here is the official breakdown:
Graph-level task: Predict the property of the entire graph such as classification problems with MNIST or CIFAR images or sentiment analysis for a document or paragraph.
Node-level task: Predict if a node belongs to a specific class (i.e. Karate club) or image segmentation (identify the role of a pixel in an image) or part of speech a word belongs to.
Edge-level task: Predict the relationship between node (i.e. Interaction between users) that can be classified (discovery of connections between entities or nodes). The task also consists in pruning a fully connected graph into a sparse graph.
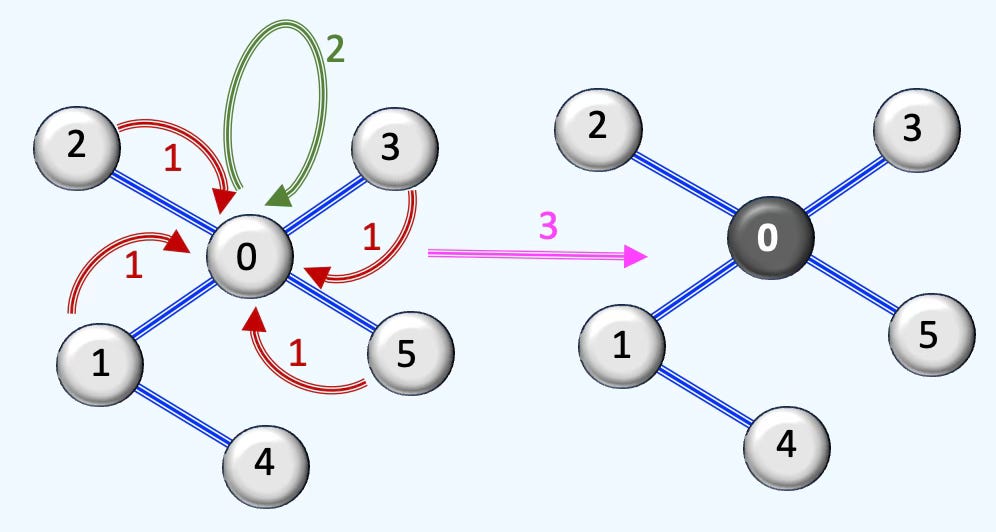
Q: What are the 3 phases of Message-passing in a Graph Neural Network?
A: The 3 phases are:
For each node in the graph, gather all the neighboring node embeddings (or messages), which is the 𝑔 function described above.
Aggregate all messages via an aggregate function (like sum, average, max,…).
All pooled messages are passed through an update function, usually a learned network.
Q: What are the benefits of using Graph Neural Networks for Point Cloud Analysis?
A: Some of the benefits are:
Handling Irregularity: Unlike traditional convolutional neural networks, GNNs can naturally handle the unordered and irregular structure of point clouds.
Local Feature Extraction: By considering the local neighborhood of each point through edge connections, GNNs can effectively learn geometric features from the point cloud.
Flexibility for Different Tasks: GNNs can be applied to various point cloud tasks like classification, segmentation, and object detection by designing appropriate network architectures.
Q: How can I convert a Graph Neural Network to Manifold Representation?
A: Nodes, edges, or graph embeddings can be projected onto a manifold, such as a hyperbolic space, spherical space, or other curved manifolds. This allows the graph to be represented in a geometric structure optimized for the task.
Converting a GNN to a manifold typically means:
Embedding nodes or edges into a manifold.
Performing computations (e.g., message passing or distance metrics) directly in the manifold space.
Q: What does edge_index represent in the context of graph data in PyTorch Geometric?
A: The edge_index attribute is a 2-row, multi-column tensor that represents the graph's edge connections in PyTorch Geometric. Each column defines an edge, where:
The first row contains the source nodes.
The second row contains the corresponding target nodes.
It serves as the sparse representation of the adjacency matrix, encoding the connectivity of the graph.
Q: What is the role of PyTorch data.train_mask in graph-based learning [PyTorch]?
A: In PyTorch Geometric, the data.train_mask attribute is a boolean mask used to identify which nodes belong to the training set in node classification tasks.
train_mask[n] = True The nth node in the dataset is used for training
train_mask[n] = False The nth node in the dataset is not used for training
The same logic applies for the data.val_mask filter.
Q. Is a graph sampling-based inductive learning method conceptually similar to: Breadth-first search (BFS)? Depth-first search (DFS)?
A: The method for graph sampling-based inductive learning is similar to Depth-first search
Q. In the context of edge prediction on a graph, what does batch_size represent?
A: For task related to classification or regression of graph edges, the batch_size is the number of edges contained in a mini-batch
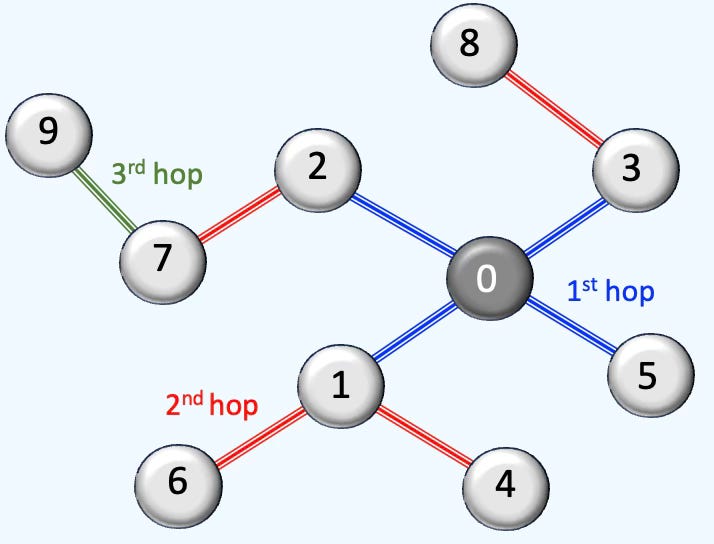
Q. Which of the following configurations [number of neighbors first hop, number of neighbors second hop, … ] is most suitable for a neighbor node sampler in a Graph Neural Network: [4, 8, 8], [8, 4, 2], [8, 4, 4, 2]?
A:
[4, 8, 8] The first hop contains less nodes than the subsequent hops causing instability as it prioritizes long-range dependencies.
[8, 4, 4, 2] The 4th hops in the random walk increases the computational cost for training while potentially degrading the performance
[8, 4, 2] Best option, although [8, 4] may result in similar performance for less computational cost
Q What are the two main categories of Bayesian Optimization to tune a Graph Neural Network?
A: Two basic models:
Gaussian Process
Tree-based Parzen Estimator
Q: What is the homophily ratio in a Graph Neural Network?
A: The homophily ratio in a Graph Neural Network (GNN) quantifies how often nodes in a graph are connected to other nodes with the same label or class. It’s a key measure for understanding how well GNNs are likely to perform, especially those that rely on message passing—which typically assumes that connected nodes share similar features or labels.
Let G=(V,E) be a graph with a set of nodes (vertices) V, a set of edges E, label yv of node v and a set of neighbors of node v, N(v).
There are 3 homophily ratios:
Node homophily: average fraction of same-label neighbors per node.
Edge homophily: fraction of edges connecting nodes with the same label
Class-insensitive edge homophily: adjusts for class imbalance by computing same-label edge fractions per class, then averaging. across the C classes
Q: What distinguishes the node homophily ratio from the edge homophily ratio?
A: Simple distinction
Edge homophily ratio: The fraction of edges in a graph which connects nodes that have the same class label. It answers the question, How likely is it that a random edge connects same-label nodes?
Node homophily ratio: Edge homophily is normalized across neighborhoods. It answers, How homophilic is the neighborhood of a typical node?
Q: What are the key attributes that define the complexity of a Graph Neural Network?
A: Here are few attributes:
Number of graph convolutional and attention layers
Graph pooling layer
Node or edge neighbor sampling method
Residual connections
Heteromophilic nodes
Inclusion of isolated nodes
Aggregation method
Data transformation prior aggregation
Q: What factors contribute to the discrepancy between node and edge homophily ratios?
A: Actually there are several factors, among them,
Edge homophily tends to be biased toward high-degree nodes
Node homophily typically excludes isolated nodes
Edge homophily is overstated in case of class imbalance (one class contains most of high degree nodes)
Q: What is the purpose of GraphSAGE?
A: GraphSAGE (short for Graph Sample and AggregatE) is an approach designed to address the scalability issues faced by traditional graph neural networks., GraphSAGE introduces an inductive learning framework that allows the model to generate node embeddings for unseen nodes during inference, making it particularly useful for dynamic and large-scale graphs.
Q: What are the two types of Graph Convolutional Neural Networks?
A: Graph convolutional neural networks are categorized as either Spatial or Spectral.
Spatial Graph Convolutional Networks use spatial features to learn from graphs that are in spatial space.
Spectral Graph Convolutional Networks use Eigen-decomposition of graph Laplacian matrix for information propagation along nodes. These networks were inspired by wave propagation in signals and systems (Fourier or Wavelets).
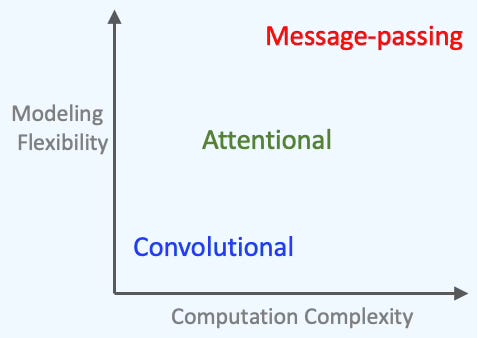
Q: Can you compare the 3 graph neural architectures, Message passing, Convolutional and attentions in term of computation complexity and modeling flexibility?
A: A picture worth a thousand words.
Q: Can you list some common random node walking/sampling for Graph Neural Networks?
A: Here some examples of node or link sampling methods as implemented in the PyTorch Geometric library?
NeighborLoader
RandomNodeLoader
GraphSAINTNodeSampler
GraphSAINTEdgeSampler
ShaDowKHopSampler
GraphSAINTRandomWalkSampler
ClusterLoader
Q: How would you formulate permutation invariance for a Graph Neural Network?
A: Given a permutation matrix P and node X={x1, .. xn}
Q: How would you formulate permutation equivariance for a Graph Neural Network?
A: Given a permutation matrix P and node X={x1, .. xn}:
Q: How equivariance on manifolds differs from equivariance in Graph Neural Networks?
A: The distinction is not always clear in the literature. In any case,
Equivariant manifolds appear in differential geometry and Lie group theory, where a smooth manifold M is considered equivariant under the action of a Lie group G (translation, rotation,…)
Equivariance in GNNs refers to the property of neural networks where transformations applied to the input graph result in equivalent transformations in the output. In GNNs, we typically deal with permutation equivariance, where the ordering of nodes in the adjacency matrix should not affect the learned representations.
Q: How Graph Neural Networks relates to Smooth manifolds in Spectral Analysis?
A: The graph Laplacian in GNNs is the discrete counterpart to the Laplace-Beltrami operator on smooth manifolds, highlighting how both systems process information through eigen-decompositions.
GNNs: Spectral GNNs leverage the graph Laplacian (eigenfunctions of the adjacency matrix) to process signals in the frequency domain.
Manifolds: The Laplace-Beltrami operator defines spectral properties, capturing intrinsic geometry.
Q: Can Graph Neural Networks explicitly model curvature?
A: Yes, Curvature-aware GNNs correspond to geometric methods on manifolds, highlighting deeper connections between network structure and geometry.
GNNs: Certain GNNs (e.g., hyperbolic GNNs) explicitly model graph curvature, improving performance on hierarchical data.
Manifolds: Manifold curvature affects geodesic distances and information flow.
Q: What is the Weisfeiler-Leman (WL) algorithm?
A: The Weisfeiler-Leman (WL) algorithm is a combinatorial graph isomorphism test that plays a crucial role in the expressiveness of Graph Neural Networks (GNNs). It is widely used in graph learning theory to analyze whether two graphs can be distinguished based on their structure.
1-WL: Track nodes and their relationships.
2-WL (or 2-FWL): Tracks pairs of nodes and their relationships.
3-WL, 4-WL, ...: Extends to higher-order tuples, increasing expressiveness.
Infinite-WL: Captures full graph isomorphism capabilities but is computationally expensive.
Q; What are the characteristics of an optimal graph model?
A: The objective of graph learning is to discover a function that can approximate the target function. The population risk is defined as a loss function.
The most common characteristics are:
Expressiveness (Representation Power): Explores if target functions can be well approximated (Graph isomorphism, Invariance/Equivariance under permutations)
Generalization: Evaluates how well the estimated function performs according to the population risk
Optimization: Investigates training algorithms such as gradient descent.
Q: Can you list metric(s) to evaluate the closeness or density of nodes in a graph?
A: Here are some examples:
Degree Centrality: Number of edges for a given node
Closeness Centrality: Average length of the shortest path between a given node and all other nodes in a graph
Betweenness Centrality: Number of times a given node lies on the shortest path between pair of other nodes in the graph
Density: Ratio between the actual number of edges and the maximum possible number of edges in the graph. A directed graph of n nodes has a maximum of n(n-1) edges. An undirected graph has a maximum of n(n-1)/2 edges.
Eigenvector Centrality: Eigenvector centrality is a graph metric that measures the influence or importance of a node based not just on how many connections it has (like degree centrality).
Page Rank: PageRank is a graph-based algorithm that ranks the importance of nodes based on the structure of incoming links.
Graph Density: The graph density is a measure of how many edges are in a graph relative to the maximum possible number of edges.
Node Homophily: Compute the average fraction of same-label neighbors per node.
Edge Homophily: Computes the fraction of edges connecting nodes with the same label
Q: How is Degree Centrality computed?
A: For a node V with an undirected graph of N nodes:
A directed graph requires the computation of a in-degree and out-degree centrality:
The values are between 0 and 1. It measures local important and is quite sensitive to data quality. All links ore edges have equal weights.
Q: What is the formula to compute the Closeness Centrality?
A: Closeness Centrality indicates how quickly a node v, can reach any other nodes in a Network N.
Some limitation of Closeness Centrality is lack of support for disconnected graph, requirement of shortest path and computation costs.
Q: How can I computed the Betweenness Centrality?
A: Give the number of paths σ associated with node, s, t and v.
Betweenness centrality measures how much a node controls the flow of information in a network, based on how often it lies on the shortest paths between others. It is a powerful global metric for influence, vulnerability, and network flow analysis.
Q: What is the formula to compute the Eigenvector Centrality?
A: Eigenvector centrality is a recursive graph metric that measures the importance of a node based not just on how many connections it has, but also on how important its neighbors are.
Given an Adjacency matrix A and λ the largest eigenvalue of A
Q: How is PageRank of a graph computed?
A: PageRank is a recursive formula that estimates how a node is important if it is linked to by other important nodes. Edges with higher ranked node counts more.
Give an adjacency matrix A, a damping factor 0.5 < d < 1.0 the PageRank vector r of dimension n is computed recursively.
Q: What is the formula for computing a Graph Density?
A: Graph density measures how connected a graph is
For undirected graph:
Directed graph:
Q: What is NetworkX library?
A: NetworkX is a BSD-license powerful and flexible Python library for the creation, manipulation, and analysis of complex networks and graphs. It supports various types of graphs, including undirected, directed, and multi-graphs, allowing users to model relationships and structures efficiently
Q: Can you list the various way to implement or represent an adjacency matrix?
A: · Given that a breath and depth first search have the same time complexity O(|V| + |E|)
An adjacency matrix for V nodes graph has a space complexity O(|V|2) .
An edge list of tuples (Source – Target pair) has a space complexity O(|V|)
An adjacency list (Source – Neighbors list) as a space complexity O(|V| + |E|)
Q: What is the purpose of normalization in Graph Convolutional Neural Network?
A: The purpose of normalization factor in Graph Convolutional Networks is that nodes with few neighbors are more important than others.
Q: What are Graph Diffusion Models?
A: Generative diffusion models are applicable to graph-structured data, with message passing respecting the graph’s symmetry. It defines diffusion over graph topologies—useful for generating graphs or node features.
Q: What are Natural Graph Networks?
A: Natural Graph Networks are Graph Neural Networks with automorphic constraints. Each edge has its own message passing mechanism but all nodes share message functions.
Q: What is Oversquashing in Graph Neural Networks?
A: Oversquashing in Graph Neural Networks refers to the phenomenon where information from distant nodes is compressed into fixed-size representations, leading to poor performance for long-range dependencies. The most common causes are:
Bottlenecks for tree-like graphs or sparse ‘clustered’ graphs with narrow bridges.
Fixed size for node embeddings creating loss of information
Potential vanishing gradients for propagation from long-distance (hops) nodes.
Q: How Ricci flow overcomes Over-squashing in Graph Neural Networks?
A: It addresses the problem of graph with highly negative Ricci curvature which compresses (looses) information around bottlenecks.
The curvature relative to two nodes, x, y, using the Wasserstein distance W, computes as:
This approximation can be then used to update the weights.
Topology
Q: What is Topological Data Analysis?
A: Topological Data Analysis (TDA) is a framework that uses concepts from topology to study the shape and structure of data. It captures high-dimensional patterns, such as clusters, loops, and voids, by building simplicial complexes and computing topological invariants like Betti numbers. TDA is especially useful for revealing robust geometric features that persist across multiple scales in noisy or complex datasets.
Q: What are the advantages of using Topological Data Analysis?
A: Topological Data Analysis (TDA):
Uncovers hidden structures in complex data, such as clusters, loops, and voids, which may not be apparent through standard statistical analysis.
Supports structured, unstructured, and graph-based data.
Captures non-linear patterns and intricate relationships.
Is robust to small perturbations in input data, including noise and drift.
Q: What is a Topological Space?
A: This is a set X with a collection of subsets T, known last open sets of X that satisfy:
Empty Set belongs to T
X belongs to T
Union of open sets is open
Intersection of open sets is open
Open sets are neighborhood of points they contain.
Q: What is Euclidean Topology?
A: Topology with open sets induced by the Euclidean metric (i.e., Open balls). In this case the topology is generated by the metric.
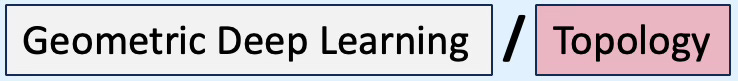
Q: What is Homeomorphism?
A: Homeomorphism f between two topological spaces is a bijective map for which f and its inverse are continuous.
Q: What are Hausdorff Spaces?
A: These are spaces for which points are separable and can be included into their open sets that do not intersect.
Q: What is the Basis of a Topological Space?
A: Elementary sets that are used to generate other open sets through union.
Q: What is Homotopy?
A: Homotopy is a fundamental idea in topology about continuously deforming one shape into another — like stretching, bending, or twisting — without tearing or gluing. Two shapes (or functions) are homotopic if you can "morph" one into the other smoothly over time. Turning a circle into a square by continuously pushing and pulling the edges, without cutting or attaching new parts.
Q: What does homotopic functions or models mean?
A: Two functions or models that can be deformed into each other.
Q; What is persistent homology?
A: Persistent homology is a method from topological data analysis (TDA) that captures the shape of data across multiple scales. It tracks topological features—such as connected components, loops, and voids—as they appear and disappear in a growing family of simplicial complexes (typically built from point clouds using a distance threshold). The result is a summary called a persistence diagram or barcode, which shows how long each feature "persists" as the scale changes, distinguishing signal from noise in the data's geometry.
Q: What are simplicial complexes?
A: Simplicial complexes (or simplicial networks) are a generalization of graphs that model higher-order relationships among data elements—not just pairwise (edges), but also triplets, quadruplets, and beyond.
While nodes in a standard graph are connected by edges, nodes in a simplicial complex form simplices:
0-simplex => node
1-simples => Edge
2- simplex => Triangle
3-simplex => Tetrahedron
Q: What are Combinatorial Complexes?
A: In Topological Data Analysis (TDA), combinatorial complexes are structured collections of simple building blocks (like vertices, edges, triangles, etc.) that model the shape of data in a way that is amenable to algebraic and computational analysis.
The allows data scientists to
Modeling data shape: They provide a combinatorial encoding of the geometric structure of a dataset
Computing topological features: Once the complex is built, one can compute homology to infer loops and voids.
Scalability: Their combinatorial nature makes them suitable for efficient computation of persistent homology.
The most common types of Simplicial, Cell, Cubical, CW and Vietoris-Rips complexes.
Q: What are Cell Complexes?
A: Mathematically, Cell Complexes are topological spaces obtained as a disjoint union of topological disks (cells), with each of these cells being homeomorphic to the interior of a Euclidean ball. They are general and flexible structures used to build topological spaces from basic building blocks called cells, which can be points, lines, disks, and higher-dimensional analogs. A cell complex is formed by gluing together cells of different dimensions in a structured way:
0-cell: point (node or vertex),
1-cell is a line segment
2-cell is a disk),
3-cell is a solid volume)
Q: What is the difference between a Simplicial Complex and a Cell Complex?
A: Simplicial Complexes are composed of simplices such as triangles, tetrahedrons while Cell Complexes uses objects like disk, sphere or cylinders.
Simplicial Complexes are mainly used in persistent homology and Cell Complexes are applied to modeling networks.
Q: What are the applications of Simplicial Complexes?
A: Here are 3 known applications:
Simplicial Neural Networks (SNNs): Generalize GNNs to operate on higher-order simplices
Topological feature learning: Capturing homology (holes, loops) in data
Geometric Deep Learning: Understanding data with complex relational structure
Q: What are Betti numbers?
A: In Topological Data Analysis (TDA), Betti numbers are key topological invariants that count the number of certain types of topological features in a space. They provide a concise summary of the space's shape and structure, especially when dealing with high-dimensional or complex datasets.
Dimension 0: Connected components and clusters
1: One-dimensional holes and lops
2: Two-dimensional holes (voids in 3D)
k > 2: Generalized holds in high dimension
Q: What are sheaves?
A: Sheaves are mathematical tools that help track local data on a space and describe how it glues together consistently across overlapping regions. Sheaves generalize persistent homology by allowing richer types of data (e.g., vector spaces, functions, distributions) to be tracked over networks, graphs, or topological spaces, enabling multi-scale, context-aware analysis.
Sheaved allows to restrict data to smaller regions and resolves inconsistencies between overlapping regions.
Q: What is a filtration in Topological Data Analysis?
A: A Filtration is a nested sequence of topological spaces (typically simplicial or cell complexes) built from data, where each space includes the previous one. Each of these topological spaces, represents the data’s topology at a certain scale or resolution, allowing us to track how features like connected components, loops, and voids appear and disappear over time.
The most common applications are
Capturing multi-scale topological structure in noisy, high-dimensional data.
Computing persistent homology
Q: What is the Vietoris-Rips filtration?
A: The Vietoris–Rips filtration captures how topological features (like clusters, loops, voids) appear and disappear as the scale changes. This persistence is visualized in barcodes or persistence diagrams. The Vietoris–Rips filtration is one of the most common constructions in Topological Data Analysis (TDA) for extracting topological features from a point cloud.
Q: A function space is a manifold composed of which type of functions?
A: 2 Square-integrable functions: They are defined as
Q: What is the dimensionality of a Hilbert Sphere?
A: A manifold with infinite dimensions: Hilbert space is defined by continuous functions and therefore has infinite dimension.
Q: What are the two primary categories of models used for feature reduction while preserving distances?
A: The two categories are
Models that preserve the global distance such as PCA
Models that preserve local distances such as t-SNE
Q: What formula does Uniform Manifold Approximation & Projection (UMAP) use to calculate the similarity between two points, x & y?’
A: Here is the scaling formula
Q: What are the two key configuration parameters in Uniform Manifold Approximation & Projection?
A:
n_neighbors: parameter that defines the number of neighbors in UMAP. It determines the balance between global and local distances in the data visualization. A smaller number of neighbors means the local neighborhood is defined by fewer data points.
min_dist: parameter that represent the compactness in low dimension. It plays a crucial role in determining the appearance of the low-dimensional representation.
A small min_dist value allows UMAP to pack points closer together in the low-dimensional space
Q: How does decreasing min_dist affect the Uniform Manifold Approximation & Projection visualization?
A: Decreasing the value of min_dist will increase the compactness (data points moving closer together in the low-dimensional space). It highlights the preservation of local structure and can make clusters more distinct.
Q; What is Topological Deep Learning (TDL)?
A: Topological Deep Learning is an approach that incorporates ideas from topology, particularly algebraic topology, into deep learning. It focuses on the intrinsic, global properties of data that remain unchanged under continuous deformations, like stretching or bending, rather than the local structure of data. Topology studies the "shape" of data, such as connected components, holes, and voids, and TDL leverages these concepts to enhance neural network architectures or interpretability.
Q: What are the key features of Topological Deep Learning (TDL)?
A: The most mentioned features are:
Betti Numbers: Quantify the number of connected components, loops, and higher-dimensional holes.
Persistent Homology: Tracks topological features across different scales (multi-scale data analysis).
Simplicial Complexes: Generalized graph structures used to model relationships between data points.
Q: Can you list some application of Topological Deep Learning (TDL) to machine learning?
A:
Feature Engineering: Extract topological descriptors (e.g., persistence diagrams, barcodes) to improve input features for models.
Regularization: Use topological constraints to enforce desirable properties (e.g., smoothness or sparsity).
Model Interpretability: Analyze neural network behavior using persistent homology or topological summaries.
Q: What are the key differences between Topological Deep Learning (TDL) and Geometric Deep Learning (GDL)?
A:
Purpose: TDL: Global, intrinsic properties. GDL: Local geometrical properties
Invariance: TDL: Continuous deformation. GDL: Equivariant under rotation, translation,…
Data types: TDL Point clouds, simplicial complexes. Cells, GDL: Graph, Manifolds, Grids
Mathematics: TDL Algebraic Topology, GDL: Differential Geometry
Q; What are Posets?
A: Posets are Partially Ordered Set which pear in causal structures, stratified space and singular manifolds.
A poset is a set P equipped with a partial order <= satisfying
Reflexivity: x <= x
Anti-symmetry: if x <= y and y <= x then x ==y
Transitivity: if x <= y and y <= z then x <= z
For example, in discrete differential geometry, simplicial complexes are often treated as posets, where simplices are ordered by inclusion. This is fundamental in topological data analysis (TDA) and persistent homology.
Q; What is the Category Theory?
A: Category Theory is a branch of mathematics that deals with abstractions of mathematical structures and the relationships between them. It focuses on how entire structures relate and transform via morphisms.
A category consist of:
Objects such as sets, vector spaces, groups, or topological spaces
Morphisms: structure-preserving mappings between objects such as functions between sets or linear maps between vector spaces.
Q: What are the conditions a Category has to satisfy?
A: A category must satisfy the Composition and Identity rules
Identity morphism:
Composition of morphisms
Identity invariance
Associativity of morphisms
Q; What is the difference between a Category and a Group?
A: A category is a group if it has only one object. Once you add another object into a group/category it cannot be a group.
Therefore a group is a category with
Single object
All morphisms are isomorphic
Q: What are Functors?
A: Functors maps objects between categories. Given a functor F and a category A
Q: What are Abelian Groups?
A: Although groups satisfy the conditions of associativity, closure, identity and inverse, their elements usually do not commute. Abelian groups are groups that support commutativity.
Q: What are Subgroups?
A: A subgroup G of a group H must satisfy
Composition of elements of the subgroup belongs to the subgroup
Inverse of elements of the subgroup belongs to the subgroup
The notation is G <= H
Q: What is a Group Homomorphism?
A: These are structures that preserves maps between groups. A group homomorphism between groups (G, .) and (G’, *) is a map defined as:
Q: What is a Group Action?
A: Given a group G and a set X, a left group action is defined as:
Q: What is a Group Orbit?
A: Given a group G and action on set X, the subset S of X is a Group Orbit if
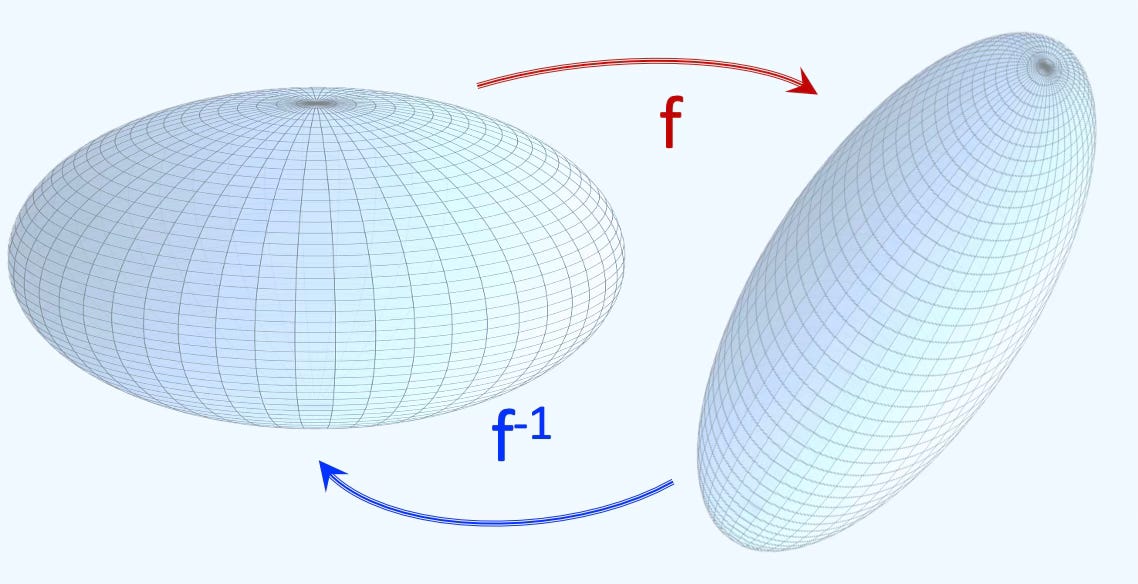
Q: How can you visualize the Quotient Space?
A: Here is an illustration of the quotient of image space and label space in a traditional classification problem.
Q: How can Category Theory benefits machine learning?
A: Category theory provides a high-level, abstract mathematical framework that can offer several potential benefits for machine learning (ML), particularly in terms of compositionality, abstraction, and generalization
Compositionality: Building Complex Models from Simple Parts
Abstraction and Generalization: Category theory allows researchers to generalize concepts across different ML paradigms, such as neural networks, probabilistic models, and optimization.
Probabilistic Reasoning and Bayesian Inference: Categorical probability provides a structured way to reason about probability distributions and Bayesian inference.
Representation Learning: Functors and natural transformations provide a structured way to define data representations across different domains
Graph-Based Learning and Geometric Deep Learning: Many concepts in graph theory and topology have categorical counterparts. Graph Neural Networks (GNNs) can benefit from category-theoretic insights by representing nodes and edges as categorical objects and morphisms.
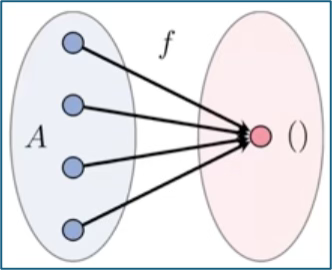
A: What is a terminal object in a Set Category?
Q: A terminal object or unit set, denoted () is the output of a function with multiple category objects as input.
Q: How can I apply Category Theory to Graph Neural Networks?
A: The graph is a category and the transformation of graph through message passing is a Functor.
Q: Can you use Functors as Group Representations?
A: Yes, A functor maps group of symmetries (i.e., morphisms in the group) to linear transformations (morphisms in the category of vector spaces). The category of vector spaces supports addition, multiplication by a scalar, associativity and distributivity).
Q; What is Equivariance in Category Theory?
A: A Neural Network layer is a linear function f from a vector space V to a vector space V’, given a symmetry group g the representations are defined as:
A functor F is G-equivariant if and only if
Q: What are Natural Transformations in the context of Neural Networks?
A: A Natural transformation is a morphism between two functors F and G defined as:
Equivariance as a natural transformation.
Manifolds
Q: What are the main categories of geometric priors?
A: The commonly accepted categorization of geometric priors is:
Symmetry and invariance: One of the most common geometric priors is to encode symmetries and invariances to different types of transformations such as translation or rotation
Stability: Small distortions are responsible for variations within a class, whereas larger distortions can map data instances from one class to another. The size of the distortion between two data instances then captures how “close”, or similar, one data instance is to another.
Scaling: Multiscale, hierarchical representations can be exploited to provide effective representational spaces for learning
Q: What are the most common type of Geometric Deep Learning Layers?
A: Here is an approximate list:
Linear equivariant layers: The core component of geometric deep learning models is linear layers, such as convolutions, that are equivariant to some symmetry transformation. The linear transform itself needs to be constructed for the geometric category considered.
Non-linear equivariant layers The canonical way to introduce non-linearity in an equivariant manner it to do so via pointwise non-linear activation functions (e.g. ReLUs), although other forms of non-linearity tailored specifically to the underlying geometry are sometimes considered.
Local averaging layers Such operations impose local invariances at certain scales, ensuring stability and leading to multi-scale, hierarchical representations by stacking multiple blocks of layers.
Global averaging layers: To impose global invariances in geometric deep learning models, global averaging layers are often employed, such as global pooling layers.
Q: How is Differential Geometry applicable to Machine Learning?
A: The following highlights the advantages of utilizing differential geometry to tackle the difficulties encountered by researchers in the creation and validation of generative models.
Understanding data manifolds: Data in high-dimensional spaces often lie on lower-dimensional manifolds
Improving latent space interpolation: Differential geometry offers methods to interpolate more effectively within these spaces, ensuring smoother transitions and better quality of generated samples.
Optimization on manifolds: The optimization processes used in training generative models can be enhanced by applying differential geometric concepts
Geometric regularization: Incorporating geometric priors or constraints based on differential geometry can help in regularizing the model, guiding the learning process towards more realistic or physically plausible solutions, and avoiding overfitting.
Advanced sampling techniques: Differential geometry provides sophisticated techniques for sampling from complex distributions (important for both training and generating new data points).
Q; What is a manifold?
A: A manifold is a topological space that, around any given point, closely resembles Euclidean space. Specifically, an n-dimensional manifold is a topological space where each point is part of a neighborhood that is homeomorphic to an open subset of n-dimensional Euclidean space. Examples of manifolds include one-dimensional circles, two-dimensional planes and spheres, and the four-dimensional space-time used in general relativity.
Q: What is a smooth manifold?
A: Smooth or Differential manifolds are types of manifolds with a local differential structure, allowing for definitions of vector fields or tensors that create a global differential tangent space.
Q: What is a Riemannian Manifold?
A: A Riemannian manifold is a differential manifold that comes with a metric tensor, providing a way to measure distances and angles. The Riemannian metric is like a local ruler that tells you how to measure lengths and angles in each tangent space of a manifold, which may be curved or non-Euclidean.
Q: What is a tangent space?
A: The tangent space at a point on a manifold is the set of tangent vectors at that point, like a line tangent to a circle or a plane tangent to a surface. Tangent vectors can act as directional derivatives, where you can apply specific formulas to characterize these derivatives. Intuitively, the directional derivative measures how a function changes as you move in a specific direction.

Given a differentiable function f, a vector v in Euclidean space Rn and a point x on manifold, the directional derivative in v direction at x is defined as:
and the tangent vector at the point x is defined as
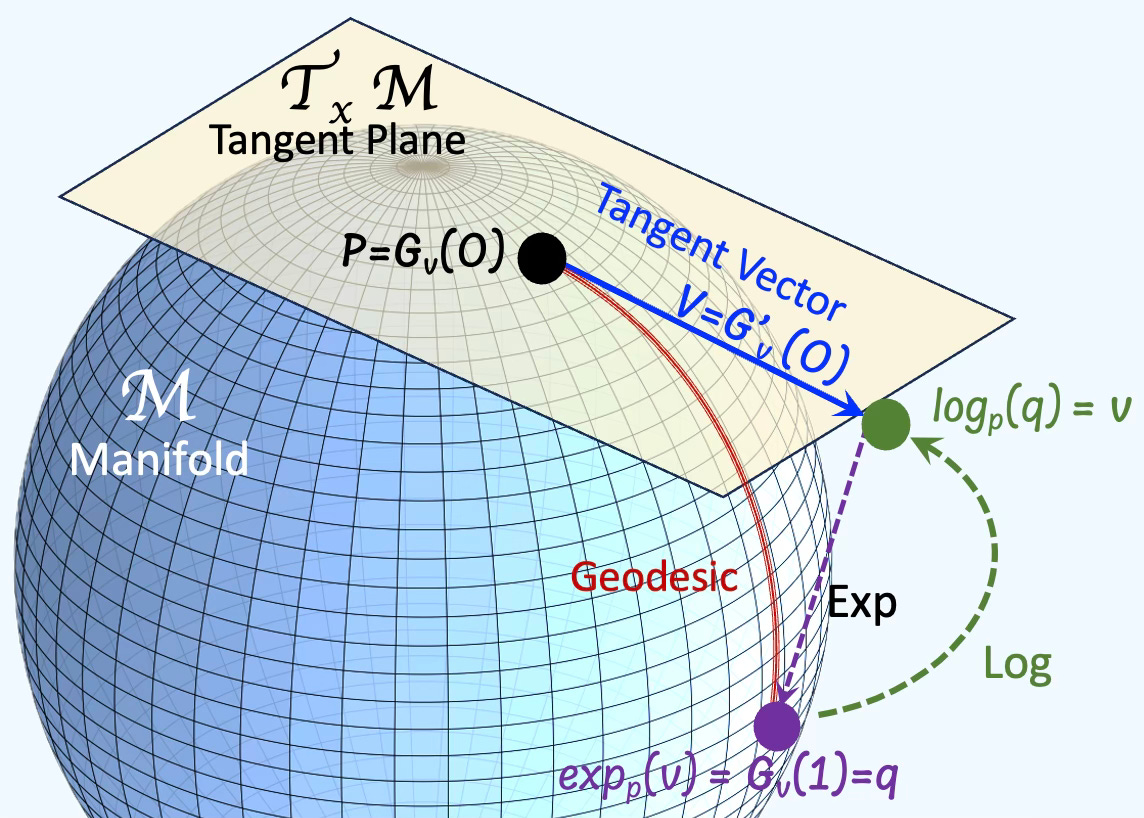
Q: What is an exponential map?
A: An exponential map is a map from a subset of a tangent space of a Riemannian manifold. Given a tangent vector v at a point p on a manifold, there is a unique geodesic Gv and a exponential map exp that satisfy:
Q: What is a logarithm map?
A: In Riemannian geometry, the logarithm map (or log map) is a fundamental tool that translates points on a manifold back to the tangent space at a base point, typically to linearize the geometry for computation or analysis.
Given two points P and Q on a manifold, the vector on the tangent space v from P to Q is defined as:
It maps a point on the curved space back to a vector in flat space (the tangent plane at p).
It’s the inverse of the exponential map, which sends a tangent vector to a point on the manifold.
Q: What are Geodesics?
A: Geodesics are curves on a surface that only turn as necessary to remain on the surface, without deviating sideways. They generalize the concept of a "straight line" from a plane to a surface, representing the shortest path between two points on that surface.
Mathematically, a curve c(t) on a surface S is a geodesic if at each point c(t), the acceleration is zero or parallel to the normal vector:
Given a Riemannian manifold M with a metric tensor g, the geodesic length L of a continuously differentiable curve f: [a, b] -> M
Q: What is a gauge?
A: In differential geometry, gauges refer to local choices of frames or coordinates used to describe geometric objects, particularly when those objects are defined on fiber bundles. The concept originates in physics (notably gauge theory), but in geometry, it formalizes how we consistently represent local data across a curved manifold.
A gauge in differential geometry is a local frame or coordinate system — a smooth way of representing geometric data on a manifold. Gauge transformations are changes of frame, reflecting the local symmetry of the space.
Q: What is a Spatial Convolution on a Manifold?
A: Given a signal (or data point) x on a manifold, a filter ϕ on a tangent space and a gauge s
Q: What is a Gauge Transformation?
A: A gauge, local transformation g is defined with an action A on data or signals x as
Q: What are Point Clouds?
A: Point clouds are a fundamental representation for real-world 3D data, especially when acquired via sensors like Lidar, Cameras, MRI, Ultrasounds, CT Scanner.
Unlike graph or mesh, there is no explicit connectivity between points. Unlike images or grids, point clouds are unordered, sparse, and irregular.
Point clouds are models as
Grids (Voxelization)
Manifolds (using a geodesic structure)
Sets
Graph (k-NN)
Q: What are Stratified Manifolds?
A: · A stratified space is a space decomposed into smooth manifolds (called strata) arranged in a partially ordered fashion. The strata form a poset, where a lower-dimensional stratum can be seen as a boundary or limit of a higher-dimensional one.
Q: What is a Signal Deformation?
A: In Geometric Deep Learning (GDL), a signal (function, image, ..) deformation (scaling, stretching, bending,….) refers to how a signal defined on a geometric domain (like a graph, manifold, or group) changes under transformations of that domain. A "signal" may look different depending on how the domain (e.g., a mesh, graph, or manifold) is deformed.
Given a group representation A, a signal x on a manifold X, and a group-invariant function f
Example: A function on SO(3) can be deformed through a rotation of frames.
Q: What is a Domain Deformation?
A: In Geometric Deep Learning (GDL), domain deformation refers to a transformation or distortion of the geometric structure (domain) on which signals are defined. It changes the underlying space and affects the learning process if the model is not invariant or equivariant to such changes.
Given a signal x on a manifold X, and a group-invariant function f:
A model should ideally be invariant or equivariant to deformations
Q: How does a Smooth Manifold differ from a Riemannian Manifold?
A: Riemannian manifolds are smooth manifold equipped with a metric (i.e. Riemann curvature tensor).
Examples of metrics are Euclidean metric, Spherical metric, Poincare disk in H2, Minkowski (theory of relativity) metric, Fisher Information Metric (for statistical manifolds) or Symmetric Positive Definite manifold metric
Q: How is the inner product of two tangent vectors/functions <f, g> defined?
A: The formula is similar to the inner product of two vectors:
Vectors space:
Functions space:
Q: What is the Laplace-Beltrami operator?
A: In an Euclidean space, the Laplace operator is defined as
On a Riemannian manifold with metric g:
The Laplace-Beltrami operator does not depend on the manifold’ geometry with a spectrum (eigenvalues) defined as 0 < eigenvalue 1 < eigenvalue 2 < …
Q: What is a Manifold Fourier Transform?
A: Manifold Fourier Transforms are generalizations of the classical Fourier transform to functions defined on non-Euclidean spaces, specifically Riemannian manifolds. Instead of using complex exponentials (as in Euclidean space), they decompose functions into eigenfunctions of the Laplace–Beltrami operator, which play the role of "harmonics" on curved domains.
Let M be a compact Riemannian manifold, and let ΔM the Laplace–Beltrami operator on M. Then any square-integrable function f:M→R can be expanded in terms of the eigenfunctions {ϕi} of ΔM:
The Manifold Forward Fourier Transform is defined as
Q: What is the Graph Laplacian?
A: The Graph Laplacian is an operator in spectral graph theory that encodes the structure of a graph and is widely used in graph neural networks. It is analog to the Laplacian operator in Euclidean spaces.
Given a degree diagonal matrix D and the adjacency matrix A, the Graph Laplacian is defined as L = D - A
Q: What is the difference between the Graph Laplacian and the Laplace-Beltrami operator on Manifolds?
A: The Graph Laplacian is the discrete analogy to the Laplace-Beltrami operator on continuous space.
Q: What is a Spectral Convolution?
A: A spectral convolution is defined by transforming a signal into the frequency domain using the Laplacian eigenfunction basis, applying a spectral filter (pointwise multiplication), and transforming back.
In the Euclidean space, a convolution * of f with a filter g, is defined through the Fourier transform F as
It enables generalized convolution on graphs and manifolds where translation isn’t defined. On a graph or manifold the convolution can be expressed by the eigenfunctions of the Laplacian.
Give the eigenvalues λi, a signal on graph or manifold, f, the spectral convolution * at a point x on the manifold (or graph) is defined as:
Q; What are Manifold Meshes?
A: Manifold meshes are composed of Nodes, Edges and Faces (triangular) with each edge is shared by two triangular faces. A manifold mesh is intrinsic and isometry for deformation.
Q: How does Principal Geodesic Analysis overcome the limitations of Principal Component Analysis?
A: By assuming that the data resides on a low-dimensional manifold, Principal Geodesic Analysis can effectively handle non-linear data and capture interdependencies among features.
Q: What is the purpose of computing the eigenvectors of the covariance matrix?
A: Eigenvectors represent the axes with the greatest variance, making them the most sensitive to variations in feature values.
Q: Principal components are computed in the locally Euclidean tangent space using:
Exponential map
Projection along a geodesic
Logarithmic map
A: Logarithmic map. The purpose of Principal Geodesic Analysis is to project the principal components on the geodesic using the logarithmic map.
Q: How would you intuitively define a Directional Derivative?
A: The Directional Derivative measures how a function changes as you move in a specific direction.
If you move in the direction of the steepest ascent (the gradient direction), the directional derivative is at its maximum.
If you move perpendicular to the gradient, the directional derivative is zero (meaning the function isn't changing in that direction).
If you move in the direction of descent, the directional derivative is negative.
Q: In a manifold, does the Euclidean mean of two data points (i.e., the midpoint between them) necessarily lie on the manifold?
A: No. The Euclidean mean lies on the manifold only if the manifold is flat. In a 3-dimensional space, the mean of two points A and B falls on the straight line connecting them.
Q: What is the difference between the exponential map and the logarithm map?
A: The exponential map, commonly referred as exp|p(v) maps a tangent vector v to a point p on the manifold by following a geodesic.
The logarithm map is the inverse of the exponential map. It retrieves the tangent vector that would generate a geodesic from p to another point q.
Q: When analyzing a low-dimensional structure such as a manifold, Lie group, or embedding within a higher-dimensional Euclidean space, which coordinate system should be used?
Intrinsic coordinates
Extrinsic coordinates
A: 2) Extrinsic coordinates
Q: When computing and visualizing data points on the hypersphere, should the coordinates be intrinsic?
A: No. It should be extrinsic. The data points on the manifold (Hypersphere) are always visualized in 3D Euclidean space.
Q: What are the two required arguments of the exponential map on the hypersphere, used to compute the endpoint on the manifold?
A: The end point G(1) is computed as
Therefore the two arguments are
Base data point on the Manifold
Tangent vector on the tangent plane
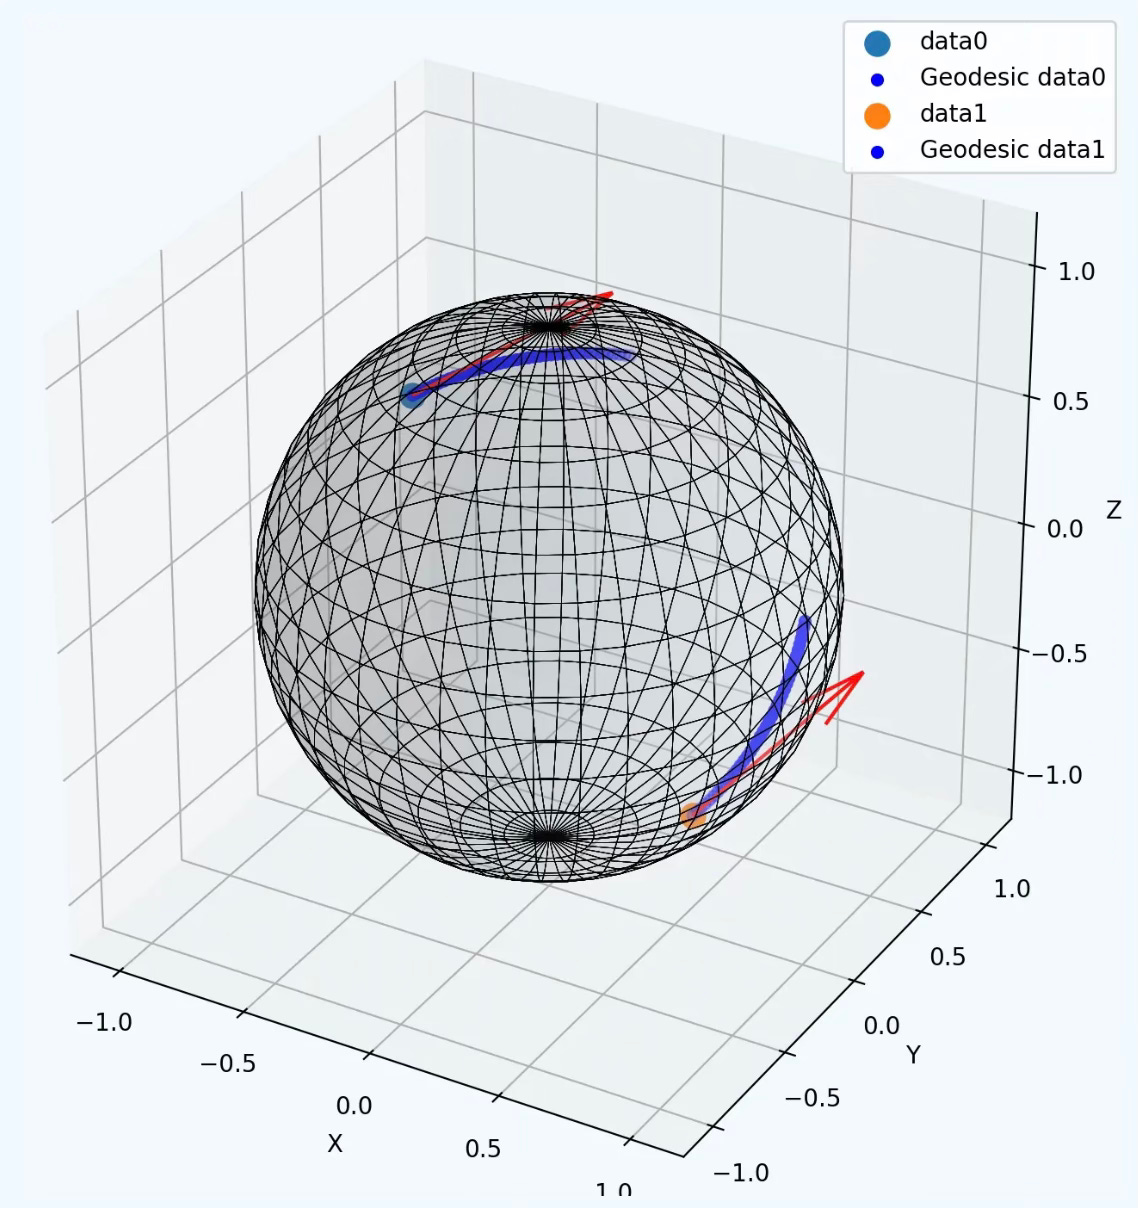
Q: What is the relationship between computing an endpoint using the exponential map and computing a geodesic?
A: A geodesic consists of an infinite (or practically large) number of points along its path. These points are obtained by applying the exponential map to a sequence of base points on the manifold, given a tangent vector that defines the direction. Thus, a geodesic can be seen as a sequence of points computed through successive applications of the exponential map.
Q: Which algorithm is most suitable for generating random data points and clusters on a hypersphere?
Uniform distribution
Von Mises-Fisher
Bounded Uniform distribution
A: Von Mises-Fisher
A uniform random generator distributes data evenly across the hypersphere, making it unsuitable for evaluating k-Means. A bounded uniform random generator can create clusters of data points but fails to preserve the local distance between each cluster point and its centroid. In contrast, the Von Mises-Fisher distribution is specifically designed to account for the curvature of the manifold, making it more suitable for clustering on a hypersphere.
Q: What is the role of the exponential map in differential geometry?
A: The exponential map is used to project an end data point onto a manifold given a point of the manifold and a tangent vector. It is also used to compute geodesics.
Q: Can you list some Manifold-Graph Neural Network (GNN) Architectures?
A: Few models are been introduced lately. Here are the 3 most cited architectures:
Hyperbolic GCN (HGCN):
Maps graph nodes to hyperbolic space.
Uses hyperbolic geometry to compute aggregations and convolutions.
Spherical GNNs:
Operate directly in spherical spaces, suitable for periodic or circular data.
Manifold-based Message Passing:
Extend the standard message-passing framework of GNNs to respect manifold geometry.
Q: How can I reformulate an objective (or loss) function on a manifold?
A: Given a loss function, L and a search parameters Euclidean space D, the optimization of a model is defined by
On a smooth manifold we add the geometric constraints or prior C
Q: Can Generative Diffusion be used in Geometric Deep learning?
A: Here are some applications
Diffusion on Manifolds: Models designed for data constrained to lie on spheres, Lie groups, or statistical manifolds.: Example: Diffusion on hyperspheres (e.g., unit vectors), used in protein modeling or directional statistics.
Equivariant Diffusion Models: Architectures enforce symmetry constraints such as rotation or permutation equivariance. Example: SE(3)-equivariant diffusion for protein folding
Graph Diffusion Models: Applied to graph-structured data, with message passing respecting the graph’s symmetry.
Q: What are the key difference(s) between Lie groups and Equivariant Smooth Manifolds?
A: Here is a quick summary:
An equivariant smooth manifold is a differentiable space with a group action that preserves structure. A group G acts smoothly on the manifold M, and this action is equivariant, meaning it commutes with transformations of the manifold.
A Lie group is a differentiable space that is itself a group, meaning it supports smooth multiplication and inversion. The group structure has associativity, an identity element, and inverse elements. It supports a continuous and differentiable multiplication and inversion operation. Each Lie group has an associated Lie algebra, with its infinitesimal symmetries
Lie groups are often used as transformation groups, while equivariant manifolds describe spaces that remain structured under transformations.
Q: How convolution on manifolds compared with Graph Convolution?
A: Graph convolutions generalize manifold-based convolutions, showing how structured data (graphs) and continuous data (manifolds) can be processed similarly.
Manifolds: Convolution on manifolds requires special constructions like the heat kernel or differential operators.
GNNs: Use graph convolutions, which are either spatial (message-passing) or spectral (Fourier-based).
Q; What is Flow Matching?
A: The purpose of Flow Matching as a generative modeling technique is to learn a transformation (or flow) that maps a simple base distribution (like a Gaussian) to a complex target distribution (like natural images or molecular structures), without having to learn the density function directly or sample via iterative steps like in diffusion models.
Flow matching is designed to:
Learn a vector field that moves samples from a base distribution to the data distribution over a continuous time interval (usually [0, 1]).
Matches flows at intermediate steps using a supervised training objective.
Q: What is an Equivariant Neural Network?
A: An equivariant neural network is a network that respects the symmetries of the input data.
Many manifolds and geometric objects have symmetries (like rotation, reflection, translation). While standard networks don't respect symmetries, Equivariant networks build these symmetries into the architecture, leading to n Better generalization, data efficiency (smaller data sets) and better performance.
Q: What are generative diffusion models on manifolds?
A: These models are designed for data constrained to lie on spheres, Lie groups (e.g., SO(3), SE(3)), or statistical manifolds equipped with a Fisher metric.
Q: What are Neural Operators?
A: Neural operators are a class of machine learning models that learn mappings between infinite-dimensional function spaces. They are usually formulated as partial differential equations or functional regression. Neural Operators generalize to learning operators between function spaces defined on non-Euclidean domains,
Given two functions f(x) and u(x) spaces F and U, a neural operator G learn the mapping:
u(x) is the corresponding solution.
Q: What is the Ricci Curvature for Riemannian Manifolds?
A: Ricci curvature measures how much the geometry of a manifold deviates from 'being flat', focusing on how volume or distance between geodesics changes locally.
Visually, the geodesics on a manifold
Converge for curvature > 0
Are equidistant for curvature = 0
Diverge for curvature < 0
Mathematically, given the Riemann curvature tensor R(X, Y)Z and X, Y and Z vector fields.
The Ricci curvature at point p of manifold is defined as
Lie Groups & Equivariance
Q: What is a Lie group?
A: Lie groups lie at the intersection of two fundamental fields of mathematics: algebra and geometry. A Lie group is first of all a group. Secondly it is a smooth manifold which is a specific kind of geometric object. The circle and the sphere are examples of smooth manifolds. Finally the algebraic structure and the geometric structure must be compatible in a precise way.
Informally, a Lie group is a group of symmetries where the symmetries are continuous. A circle has a continuous group of symmetries: you can rotate the circle an arbitrarily small amount and it looks the same. This is in contrast to the hexagon, for example. If you rotate the hexagon by a small amount then it will look different. Only rotations that are multiples of one-sixth of a full turn are symmetries of a hexagon.
Q: What is a Lie algebra?
A: A Lie algebra is a vector space V over a base field F, along with an operation [·, ·] : V ×V → V called the bracket or commutator that satisfies the following conditions:
Bilinearity
Antisymmetry
The Jacobi Identity:
Q: What is a homogeneous space?
A: A homogeneous space is a manifold M on which a Lie group G acts transitively. This means any point can be reached from any other point via a group action. The 2-sphere S2 is a classic example. The rotation group SO(3) acts transitively on S2. The stabilizer of the north pole p=(0,0,1) is the group of rotations around the z-axis, which is isomorphic to SO(2). Therefore, we have the identification: S2≅SO(3)/SO(2)
Mathematically, topological space X is a homogeneous space if a Lie group G acts transitively on it. This means:
This implies that every point in the space can be moved to any other point via a group transformation, so no point is special.
Q: What are Lie-Equivariant Networks?
A: Lie-equivariant networks are neural networks that are equivariant to transformations from a Lie group, such as rotations, translations, scaling, or Lorentz transformations. These networks are designed to respect the continuous symmetries inherent in many scientific and geometric problems.
Lie-equivariant networks are designed to commute with these transformations at every layer of the network.
The most common Lie-Equivariant Networks are SO(3), SO(2), SE(3 and E(n)
Q: Which field(s) benefit the most from for Lie Geometry?
A: Some examples:
Robotics: Invariance in rigid body motion
Molecular research: Equivariance in translation and rotation of molecules
Computer vision: Translation, scaling and rotation tnvariance of frames and images
Q: What are Quantum Groups?
A: Quantum groups are mathematical structures that generalize Lie groups and Lie algebras, particularly in the context of non-commutative geometry and quantum physics. They were originally introduced to study symmetries in quantum systems, especially in integrable models and quantum field theory.
Q: What are the two conditions that defines a special orthogonal group?
A: For the SO(n) group,
Orthogonality of fundamental generators of rotations along X, Y and Z axes
Preservation of rotation and orientation
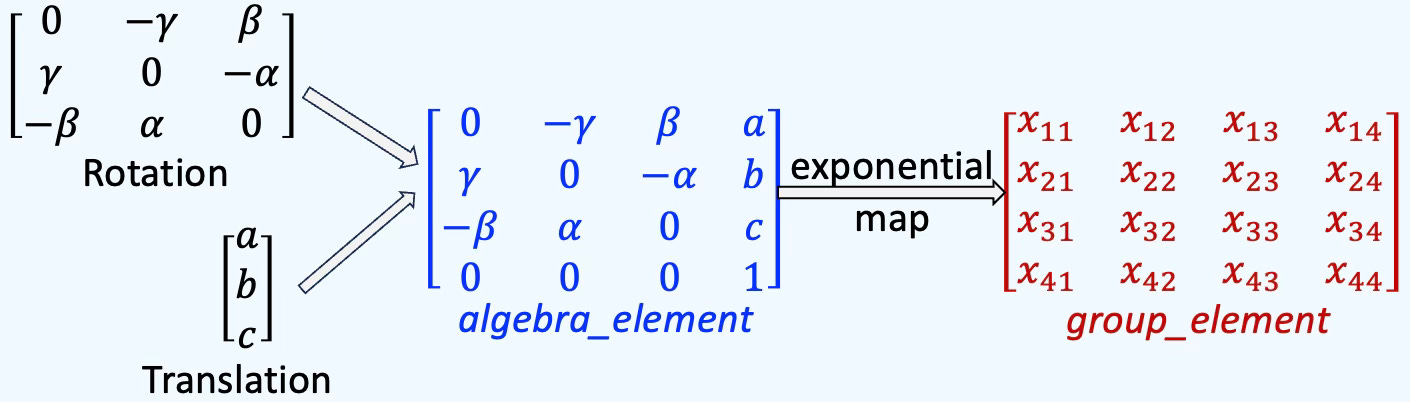
Q: What is the size of a SE3 element?
A: 4 x 4 matrix as follows:
Q: What two conditions must a Symmetric Positive Definite (SPD) matrix satisfy?
A: The two conditions are
Matrix be Positive Definite
Symmetric
Q: Which metric uses an SPD matrix as its covariance matrix?
A: The Mahalanobis distance on a manifold M between a vector x and a mean vector μ, given a covariance matrix Σ, is defined as:
x is the data point (or feature vector).
μμ is the mean of the distribution.
Σ is the covariance matrix of the data.
Q: What is the formula for generating a random SPD matrix?
A: The random values have to be positive (for Positive Definite condition) and the matrix has to be symmetric. This can be easily achieved by adding the transposed to a randomly generated matrix.
Q: What are the four axioms that a Lie group must satisfy?
A: The 4 axioms are:
Closure
Associativity
Identity
Invertibility
Q: How would you intuitively define a Lie algebra?
A: Intuitively, a Lie algebra is a tangent space of a Lie group. This actually makes sense as a Lie group is fundamentally a smooth manifold.
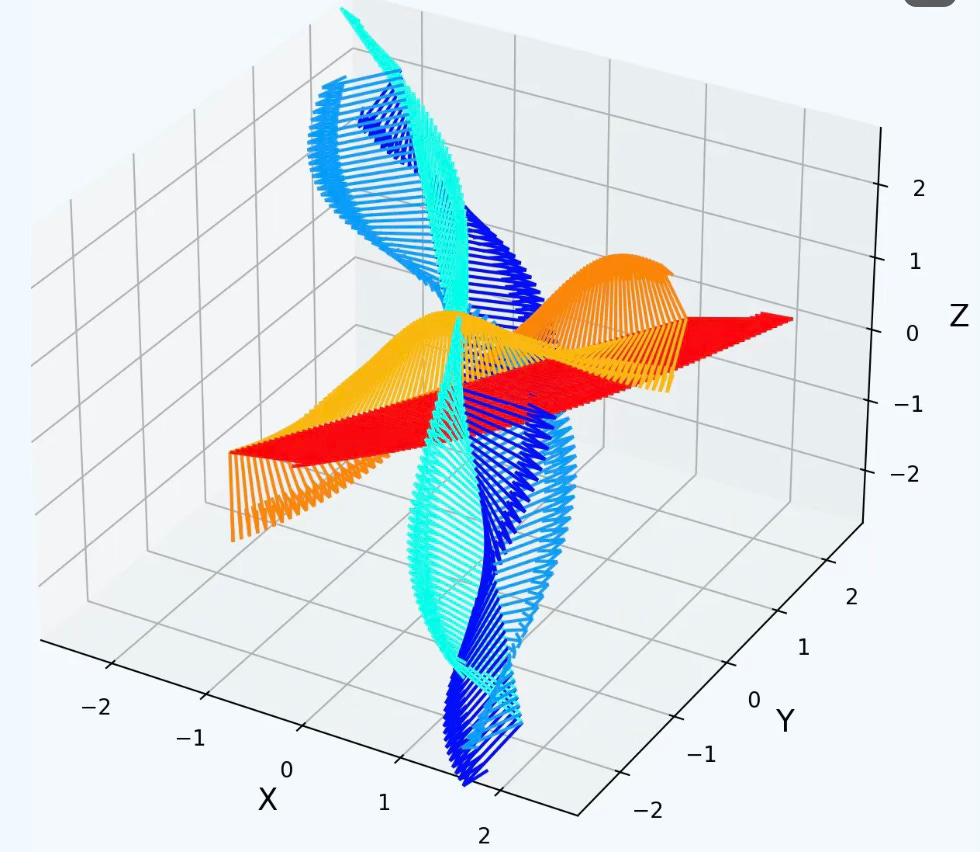
Q: What are the advantages of using the SO(3) Lie Group to generate random clusters of data points on a manifold?
A: SO3 matrices are invariant under rotation. Therefore they can be used to replicate cluster along the hypersphere
Q: What are the two types of points on manifold used in SE(3)?
A: SE(3) is both a Lie group structure and a smooth manifold. Therefore, the two types are ‘matrix’ for Lie algebra and ‘vector’ for operation of the smooth manifold.
Q: The exponential map generates SE(3) elements from a 4×4 Lie algebra matrix. How can we compute the corresponding Lie algebra matrix from a given SE(3) element?
A: Logarithm map
Q: How are the SL(n) group and its algebra defined?
A: Lie group:
Lie Algebra
Q: How does homotopy theory impact Lie groups?
A: Homotopy theory and Lie groups intersect in several important ways, especially in the study of the topological and algebraic structure of Lie groups and their homogeneous spaces. Lie groups are smooth manifolds with a group structure, meaning they are topological spaces with additional smoothness and symmetry. Homotopy theory helps classify these groups by understanding their continuous deformations.
Q: What is the font used in Lie algebra?
A: Fracktur
Q: How Category Theory relates to Lie groups?
A: Category theory can absolutely be applied to Lie groups—and in fact, it already plays a significant role in how mathematicians and theoretical physicists organize and study Lie groups and their relationships.
For example a Lie group can be modeled as an object in a category and Lie Group homomorphism as morphism.
Q: What are Equivariant Diffusion Models?
A: These Architectures enforce symmetry constraints such as rotation or [permutation equivariance.
Examples:
SE(3)-equivariant diffusion for protein folding (e.g., RoseTTAFoldDiffusion, GeoDiff)
E(n)-equivariant diffusion for molecules
Q: What is Deformation Stability?
A: Deformation stability in the context of equivariance refers to a model’s ability to remain robust to small, non-structured distortions in the input—while still respecting equivariance to structured transformations like rotations, translations, or permutations.
It measures how much the model's output changes under slight deformations that do not belong to the symmetry group (i.e., not pure rotation, shift, etc.), but are small in magnitude.
For a model f, an input x, and small deformation δx:
Q; What are Group-Invariant Convolutional Neural Networks?
A: Group-equivariant Convolutional Neural Networks (G-CNN) are a generalization of standard Convolutional Neural Networks designed to respect symmetries in data, especially group symmetries (translational, Rotational, Reflectional and Permutational).
Q: What are Q-Steerable Convolutional Neural Networks?
A: Q-Steerable CNNs are a class of convolutional neural networks designed to be equivariant under continuous group actions, particularly rotations and translations. They are used to model data with inherent symmetries while maintaining equivariance and computational efficiency.
Accidentally, 'Steer' means 'Rotate' the group elements in the design of kernels or filters to ensure equivariance. Q stands for quotient space of a Lie group over a subgroup
Information Geometry

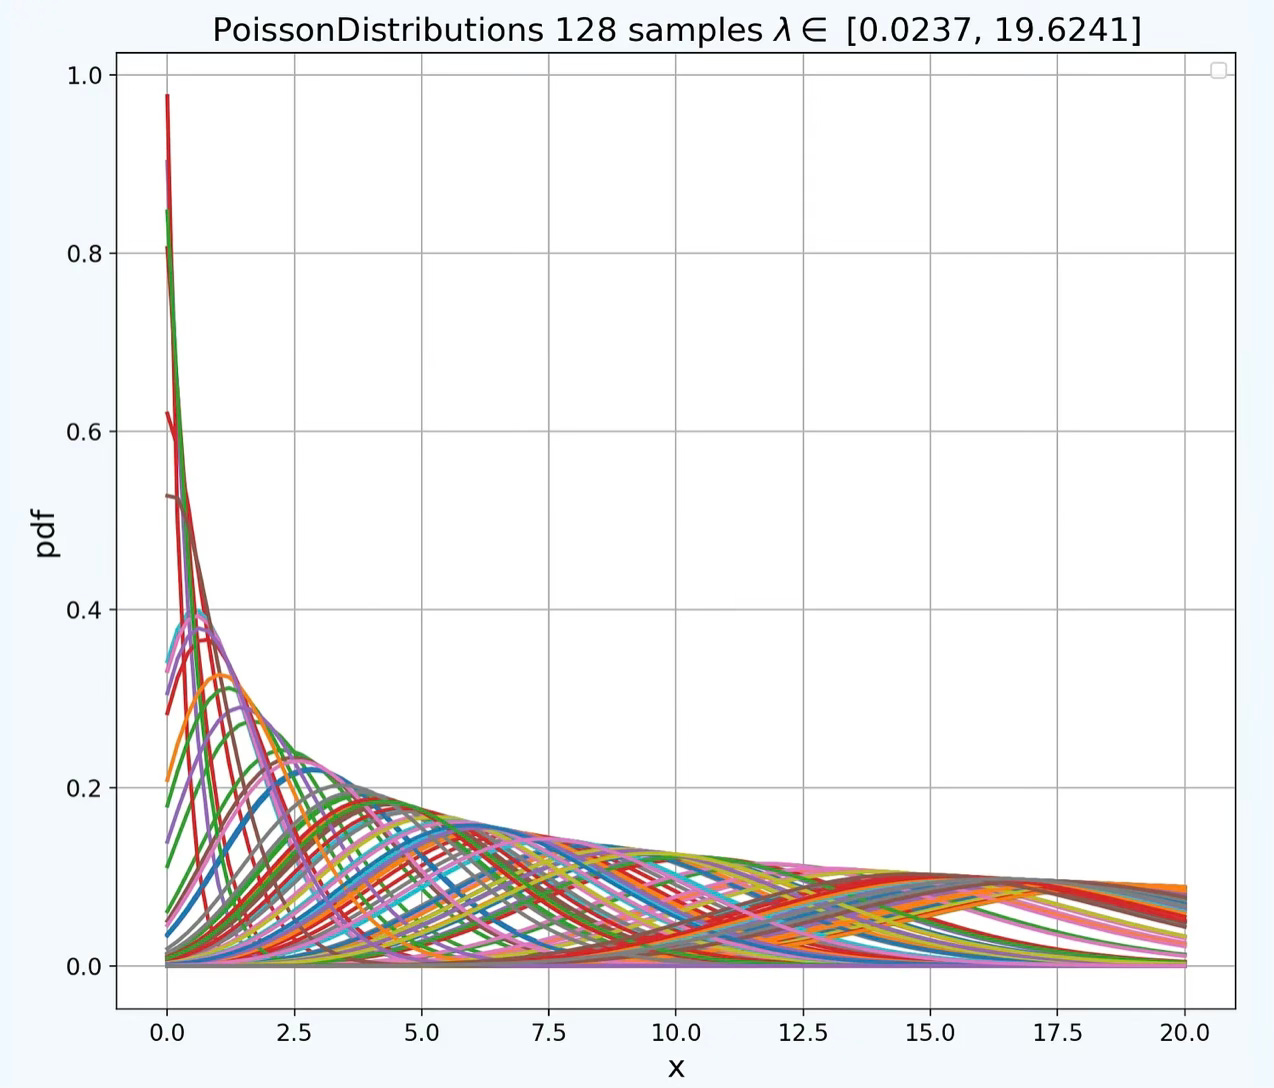
Q: What is a statistical manifold?
A: A statistical manifold is a smooth manifold in which each point represents a probability distribution, parameterized by one or more variables—for example, the rate parameter in an exponential distribution or the mean and standard deviation in a normal distribution.
By extending Riemannian geometry to the space of probability density functions, statistical manifolds provide a geometric framework for statistical inference. As such, a foundational understanding of differential geometry and Riemannian manifolds is recommended for readers.
Q: What is the Fisher-Rao metric?
A: The Fisher–Rao metric, also referred as the Fisher information matrix, is a Riemannian metric defined on a statistical manifold, which is a smooth space where each point corresponds to a probability distribution. It arises from information geometry and provides a natural way to measure distances, angles, and curvature between distributions.
Given a parametric family of probability distributions p(x;θ), where θ∈Rn is the parameter vector, the Fisher information matrix is:
Q: What are the advantages of using a Beta distribution on a manifold?
A: There are many benefits of applying the Beta distribution on a manifold, among them;
Representation of probability densities over curved spaces
Handling of non Euclidean geometries
Regularization to reduce overfitting
Smooth interpolation of pdf on a manifold
Q: What is the shape of tensor representing a point on a statistical manifold defined by n parameters?
A: The shape of the tensor is the same after the number of parameters. For instance exponential distribution has one parameter, rate so the tensor has one value. The shape of a point on the normal distribution manifold would have to components.
Q: What is the Fisher information metric of the normal distribution when the standard deviation is fixed and not treated as a parameter?
A: Using the formula [A] on the Normal distribution N(μ,σ2) the metric is
Q: Can you compute the Fisher-Rao metric manually for the exponential distribution manifold?
A: Here are the steps:
Q: What is the Natural Gradient?
A: The natural gradient, NG is an optimization method that adapts the standard gradient by accounting for the geometry of the parameter space representing probability distributions. It uses the Fisher information metric, F for the update equation.
The natural gradient accounts for curvature and ensures updates are invariant to re-parameterizations.
Q: What are Bregmann divergences?
A: Bregman divergences are a class of distance-like functions that generalize the squared Euclidean distance using a convex function. They are used in information geometry, machine learning, and optimization. They measure the curvature of a convex function ϕ between two points p and q.
Q: How the Bregmann divergence differs from the Kullback-Leibler divergence?
A: The Kullback–Leibler (KL) divergence is a special case of the broader family of Bregman divergences for which the generating function ϕ is the negative Shannon entropy
Tools & Libraries

Q: What are the two most widely used Python libraries for Geometric Deep Learning?
A: Data scientists often have preferences and strong opinions on the most suitable libraries for their environment and data. This newsletter primarily uses Geomstats(Github geomstats)for foundational concepts like differential geometry and manifolds, while PyG (Pytorch Geometric) is leveraged for Graph Neural Networks and machine learning on data manifolds.
Q: What are the most common PyTorch libraries dedicated to Topological Deep Learning
A: Ripser, Gudhi, and Scikit-TDA.
Q; What are the key features of PyTorch Geometric?
A: The key Features of PyTorch Geometric (a.k.a. PyG) are:
Efficient Graph Processing: Optimizes memory and computation using sparse graph representations.
Flexible GNN Layers: Covers GCN, GAT, GraphSAGE, GIN, and other advanced architectures.
Batching for Large Graphs: Supports for mini-batching for handling graphs with millions of edges.
Seamless PyTorch Integration: Provides full compatibility with PyTorch tensors, autograd, and neural network modules.
Diverse Graph Support: PyTorch Geometric handles directed, undirected, weighted, and heterogeneous graphs.
The most important PyG Modules are:
torch_geometric.data to manages graph structures, including nodes, edges, and features.
torch_geometric.nn to provide data scientists prebuilt GNN layers like convolutional and gated layers.
torch_geometric.transforms to pre-process input data (e.g., feature normalization, graph sampling).
torch_geometric.loader to handle large-scale graph datasets with specialized loaders.
Reference: PyG Documentation
Q: What are the key components of Geomstats library?
A: The core concept of Geomstats is to incorporate differential geometry principles, such as manifolds and Lie groups, into the development of statistical and machine learning models. This open-source, object-oriented library follows Scikit-Learn’s API conventions for seamless integration.
Geomstats serves as a practical tool for gaining hands-on experience with geometric learning fundamentals while also supporting future research in the field.
The packages are:
geometry Manifolds and Lie groups
information_geometry Statistical manifolds and Fisher-Rao metric
learning Machine learning algorithms such as PCA, kNN or k-Means on manifolds
visualization For 2D and 3D representation of manifolds and groups.
Reference: geomstats: a Python Package for Riemannian Geometry in Machine Learning N. Miolane, J. Mathe, C. Donnat, M. Jorda, X. Pennec
Q: What are the features of NetworkX library?
A: NetworkX provides a wide range of algorithms for graph theory and network analysis, such as shortest paths, clustering, centrality measures, and more. It is designed to handle graphs with millions of nodes and edges, making it suitable for applications in social networks, biology, transportation systems, and other domains. With its intuitive API and rich visualization capabilities, NetworkX is an essential tool for researchers and developers working with network data.
Q: Which Python library is commonly used to implement binary logistic regression for SPD matrices?
A: Geomstats (Github Geomstats) is widely used for studying data manifolds, including in this newsletter. However, for more specialized applications, libraries such as pyRiemann: Machine learning for multivariate data with Riemannian geometry and PyManOpt may be better suited.
Patrick Nicolas has over 25 years of experience in software and data engineering, architecture design and end-to-end deployment and support with extensive knowledge in machine learning.
He has been director of data engineering at Aideo Technologies since 2017 and he is the author of "Scala for Machine Learning", Packt Publishing ISBN 978-1-78712-238-3 and Geometric Learning in Python Newsletter on LinkedIn.
Thanks for sharing this, very rare to find such content Mr. Patrick.
👍