

Exercises Answers 🛠️


Below are the answers to the exercises from the Hands-on Geometric Deep Learning posts.
Table of Contents
From Nodes To Complexes: A Guide to Topological Deep Learning
Exploring Simplicial Complexes for Deep Learning: Concepts & Code

Introduction to Geometric Deep Learning
Q1: What are the two most widely used Python libraries for Geometric Deep Learning?
A1: Data scientists often have preferences and strong opinions on the most suitable libraries for their environment and data. This newsletter primarily uses Geomstats (Github geomstats)for foundational concepts like differential geometry and manifolds, while PyG (Pytorch Geometric) is leveraged for Graph Neural Networks and machine learning on data manifolds.
Q2: Can you name four different types of Graph Neural Networks?
A2: The list under the section Types of Graph Neural Networks is far from exhaustive, but as of January 2025, the popular models in research papers are: Graph Convolutional Networks, Graph Attention Networks, GraphSAGE, Spectral Graph Neural Networks, Graph Transformers.
Q3: What are the advantages of using Topological Data Analysis?
A3: Topological Data Analysis (TDA):
Uncovers hidden structures in complex data, such as clusters, loops, and voids, which may not be apparent through standard statistical analysis.
Supports structured, unstructured, and graph-based data.
Captures non-linear patterns and intricate relationships.
Is robust to small perturbations in input data, including noise and drift.
Q4: How does a differential (smooth) manifold differ from a Riemannian manifold?
A4: Riemannian manifolds are smooth manifold equipped with a metric (i.e. Riemann curvature tensor).
Examples of metrics are Euclidean metric, Spherical metric, Poincare disk in H2, Minkowski (theory of relativity) metric, Fisher Information Metric (for statistical manifolds) or Symmetric Positive Definite manifold metric
Q5: Between mesh-based and grid-based learning models, which has the higher computational cost?
A5: The grid-based manifold model typically has a finer granularity, with more cloud points for computing exponential and logarithm maps compared to mesh-based models. As a result, it demands significantly more memory
Insights into Logistic Regression on Riemannian Manifolds
Q1: What two conditions must a Symmetric Positive Definite (SPD) matrix satisfy?
A1: The two conditions are
Matrix be Positive Definite
Symmetric
Q2: Which metric uses an SPD matrix as its covariance matrix?
A2: The Mahalanobis distance on a manifold M between a vector x and a mean vector μ, given a covariance matrix Σ, is defined as:
x is the data point (or feature vector).
μμ is the mean of the distribution.
Σ is the covariance matrix of the data.
Q3: In code snippet 9, what would be the mean test scores if a 32 × 32 SPD matrix ( n_features = 32) is used?
A3:
Mean score for Log Euclidean metric: 0.496
Mean score for Affine Invariant metric: 0.500
Q4: What is the formula for generating a random SPD matrix?
A4: The random values have to be positive (for Positive Definite condition) and the matrix has to be symmetric. This can be easily achieved by adding the transposed to a randomly generated matrix.
Q5: Which Python library is commonly used to implement binary logistic regression for SPD matrices?
A5: Geomstats (Github Geomstats) is widely used for studying data manifolds, including in this newsletter. However, for more specialized applications, libraries such as pyRiemann: Machine learning for multivariate data with Riemannian geometry and PyManOpt may be better suited for specific problem domains.
Dive into Functional Data Analysis
Q1: Observations can be classified based on their measurement process (e.g., repeated measurements, regular time intervals). Can you list the three main categories of observed data?
A1: The 3 main categories of observations are:
Panel Data: Data with limited number of repeated measurements for each unit or subject, with varying time points across different subjects.
Time Series: Single observations made at regular time intervals, such as those seen in financial markets.
Functional Data: Data recorded over consistent time intervals and frequencies, featuring a high number of measurements per observational unit/subjects.
Q2: A function space is a manifold composed of which type of functions?
A2: 2 Square-integrable functions: They are defined as
Q3: What is the dimensionality of a Hilbert Sphere?
A3: 2) A manifold with infinite dimensions: Hilbert space is defined by continuous functions and therefore has infinite dimension.
Q4: Can you modify test code snippet #5 to compute the inner product using only the first half of each vector? What would be the value of `num_Hilbert_samples`, and what is the resulting inner product, `inner_prod`?
A4: The value of num_Hilbert_samples should be len(vector1) /2 = 4 and the inner product 0.235. The modified code for the test would look like

Q5: How is the inner product of two tangent vectors/functions <f, g> defined?
A5: The formula is similar to the inner product of two vectors:
Vectors space:
Functions space:
Uniform Manifold Approximation & Projection
Q1: What are the two primary categories of models used for feature reduction while preserving distances?
A1: The two categories are
Models that preserve the global distance such as PCA
Models that preserve local distances such as t-SNE
Q2: What formula does UMAP use to calculate the similarity between two points, x & y?’
A2:
Q3: What is the role of the n_components configuration parameter in t-SNE?
A3: In t-SNE, clusters are visualized based on the n_components configuration parameter: n_components = 2 produces a 2D (x, y) plot, while n_components = 3 generates a 3D (x, y, z) volumetric plot.
Q4: What are the two key configuration parameters in UMAP?
A4:
n_neighbors: parameter that defines the number of neighbors in UMAP. It determines the balance between global and local distances in the data visualization. A smaller number of neighbors means the local neighborhood is defined by fewer data points.
min_dist: parameter that represent the compactness in low dimension. It plays a crucial role in determining the appearance of the low-dimensional representation.
A small min_dist value allows UMAP to pack points closer together in the low-dimensional space
Q5: How does decreasing min_dist affect the UMAP visualization?
A5: Decreasing the value of min_dist will increase the compactness (data points moving closer together in the low-dimensional space). It highlights the preservation of local structure and can make clusters more distinct.
Hands-on Principal Geodesic Analysis
Q1: How does Principal Geodesic Analysis overcome the limitations of Principal Component Analysis?
A1: By assuming that the data resides on a low-dimensional manifold, Principal Geodesic Analysis can effectively handle non-linear data and capture interdependencies among features.
Q2: What is the purpose of computing the eigenvectors of the covariance matrix?
A2: Eigenvectors represent the axes with the greatest variance, making them the most sensitive to variations in feature values.
Q3: Principal components are computed in the locally Euclidean tangent space using:
Exponential map
Projection along a geodesic
Logarithmic map
A3: Logarithmic map. The purpose of Principal Geodesic Analysis is to project the principal components on the geodesic using the logarithmic map.
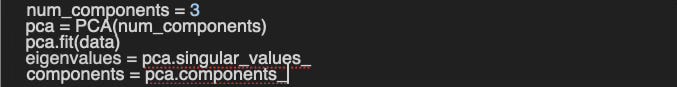
Q4: How can you extract the singular values and components of PCA using the Scikit-learn library?
A4: Sample code
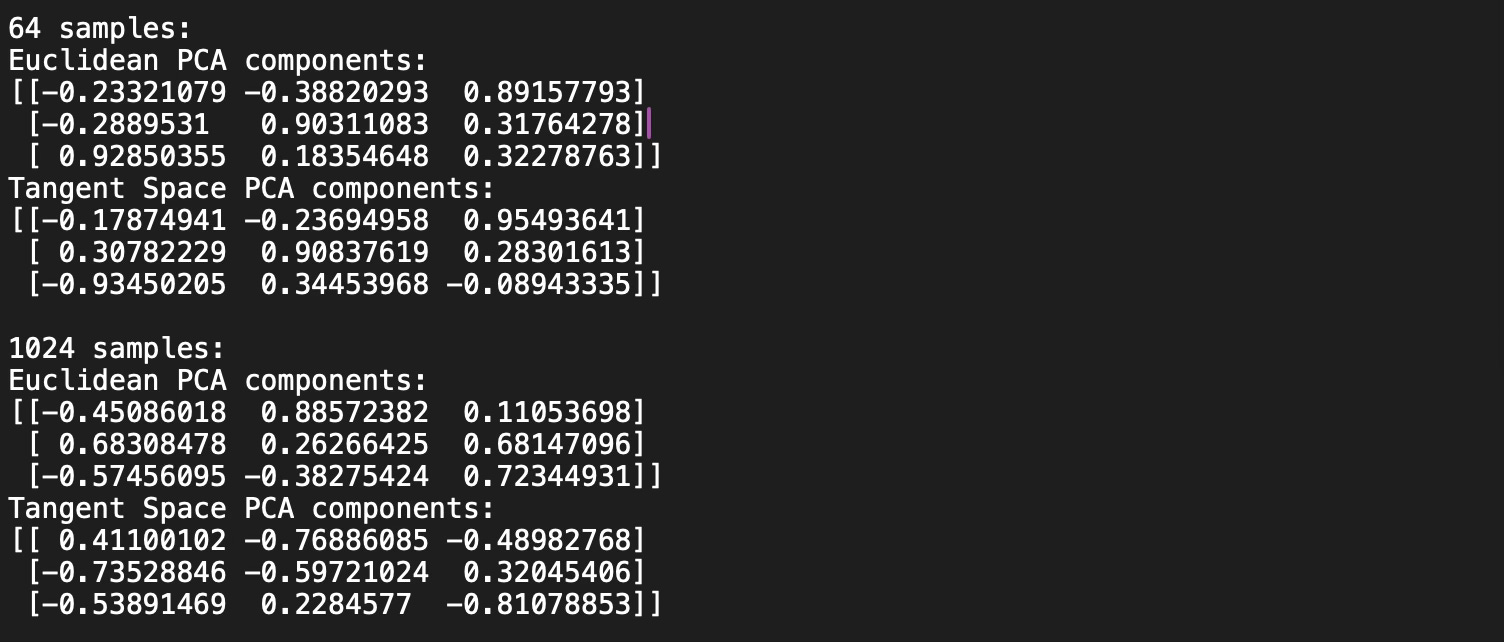
Q5: What would be the Euclidean PCA matrix and the Tangent Space PCA matrix when set to 64? 1024?
A5: The number of samples has a significant impact of the computation of both PCA and PGA
Riemannian Manifolds: 1. Foundation
Q1: How would you intuitively define a directional derivative?
A1: The directional derivative measures how a function changes as you move in a specific direction.
If you move in the direction of the steepest ascent (the gradient direction), the directional derivative is at its maximum.
If you move perpendicular to the gradient, the directional derivative is zero (meaning the function isn't changing in that direction).
If you move in the direction of descent, the directional derivative is negative.
Q2: In a manifold, does the Euclidean mean of two data points (i.e., the midpoint between them) necessarily lie on the manifold?
A2: No. The Euclidean mean lies on the manifold only if the manifold is flat. In a 3-dimensional space, the mean of two points A and B falls on the straight line connecting them."
Q3: What is the difference between the exponential map and the logarithm map?
A3: The exponential map, commonly referred as exp|p(v) maps a tangent vector v to a point p on the manifold by following a geodesic.
The logarithm map is the inverse of the exponential map. It retrieves the tangent vector that would generate a geodesic from p to another point q.
Q4: When analyzing a low-dimensional structure such as a manifold, Lie group, or embedding within a higher-dimensional Euclidean space, which coordinate system should be used?
Intrinsic coordinates
Extrinsic coordinates
A4: 2) Extrinsic coordinates
Q5: What are the four axioms that a Lie group must satisfy?
A5: The 4 axioms are:
Closure
Associativity
Identity
Invertibility
Q6: How would you intuitively define a Lie algebra?
A6: Intuitively, a Lie algebra is a tangent space of a Lie group. This actually makes sense as a Lie group is fundamentally a smooth manifold.
Riemannian Manifolds: 2. Hands-on with Hypersphere
Q1: What are the two main modules of the Geomstats library? Which module is specifically dedicated to differential geometry?
A1: Geometry and Learning
Geometry is more theoretical and implements the key components of differential geometry such as exponential, logarithm maps, geodesics, tangent space and Lie groups.
Learning extends scikit-learn framework to smooth manifolds.
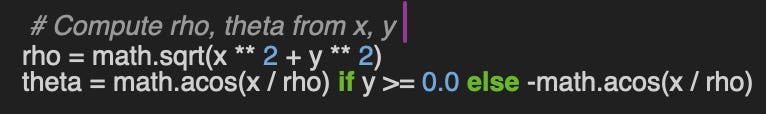
Q2: Given a point with coordinates (x, y), write a Python function to convert it to polar coordinates (rho, theta).
A2: Just two lines of code
Q3: When computing and visualizing data points on the hypersphere, should the coordinates be intrinsic?
A3: No. It should be extrinsic. The data points on the manifold (Hypersphere) are always visualized in 3D Euclidean space. The last argument of the constructor for HypersphereSpace, intrinsic, default to False.
Q4: What are the two required arguments of the exponential map on the hypersphere, used to compute the endpoint on the manifold?
A4: The end point G(1) is computed as
Therefore the two arguments are
Base data point on the Manifold
Tangent vector on the tangent plane
Given a tangent vector tangent_v and a base point base_pt, the end point is computed

Q5: What is the relationship between computing an endpoint using the exponential map and computing a geodesic?
A5: A geodesic consists of an infinite (or practically large) number of points along its path. These points are obtained by applying the exponential map to a sequence of base points on the manifold, given a tangent vector that defines the direction. Thus, a geodesic can be seen as a sequence of points computed through successive applications of the exponential map.

Insights into k-Means on Riemannian Manifolds
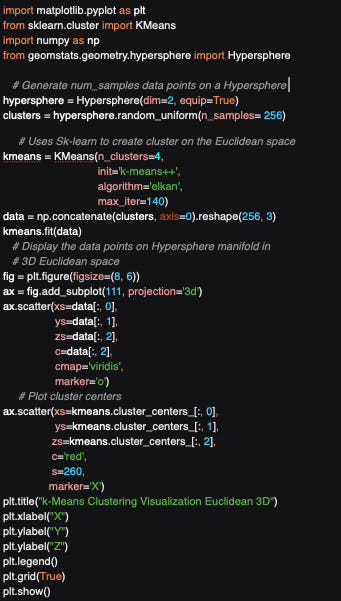
Q1: What is the recommended configuration for the implementation k-Means in Euclidean space using Scikit-learn?
A1: The two recommended configuration parameters are
Initialization: k-Means++. In this approach, the first center is selected at random from the data points and the distance from this center to all points is computed. The subsequent centers are selected at random from the data points with probability proportional to the distance.
Algorithm: Elkan: This is a variation of the ubiquitous Lloyd's algorithm that leverages the triangle inequality to reduce the number of distance computations when assigning points to clusters. The Elkan's algorithm requires storage proportional to the number of clusters and the number of data points, making it impractical for very large datasets
Q2: What are the advantages of using the SO(3) Lie Group to generate random clusters of data points on a manifold?
A2: SO3 matrices are invariant under rotation. Therefore they can be used to replicate cluster along the hypersphere
Q3: Which algorithm is most suitable for generating random data points and clusters on a hypersphere?
1- Uniform distribution
2- Von Mises-Fisher
3- Bounded Uniform distribution
A3: Von Mises-Fisher
A uniform random generator distributes data evenly across the hypersphere, making it unsuitable for evaluating k-Means. A bounded uniform random generator can create clusters of data points but fails to preserve the local distance between each cluster point and its centroid. In contrast, the Von Mises-Fisher distribution is specifically designed to account for the curvature of the manifold, making it more suitable for clustering on a hypersphere.
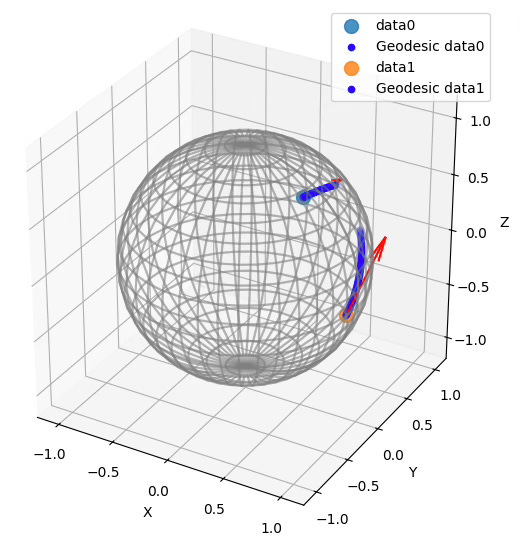
Q4: How does changing the number of samples in Code Snippet 5 affect the visualization? Reducing to 64 samples? Increasing to 1028 samples?
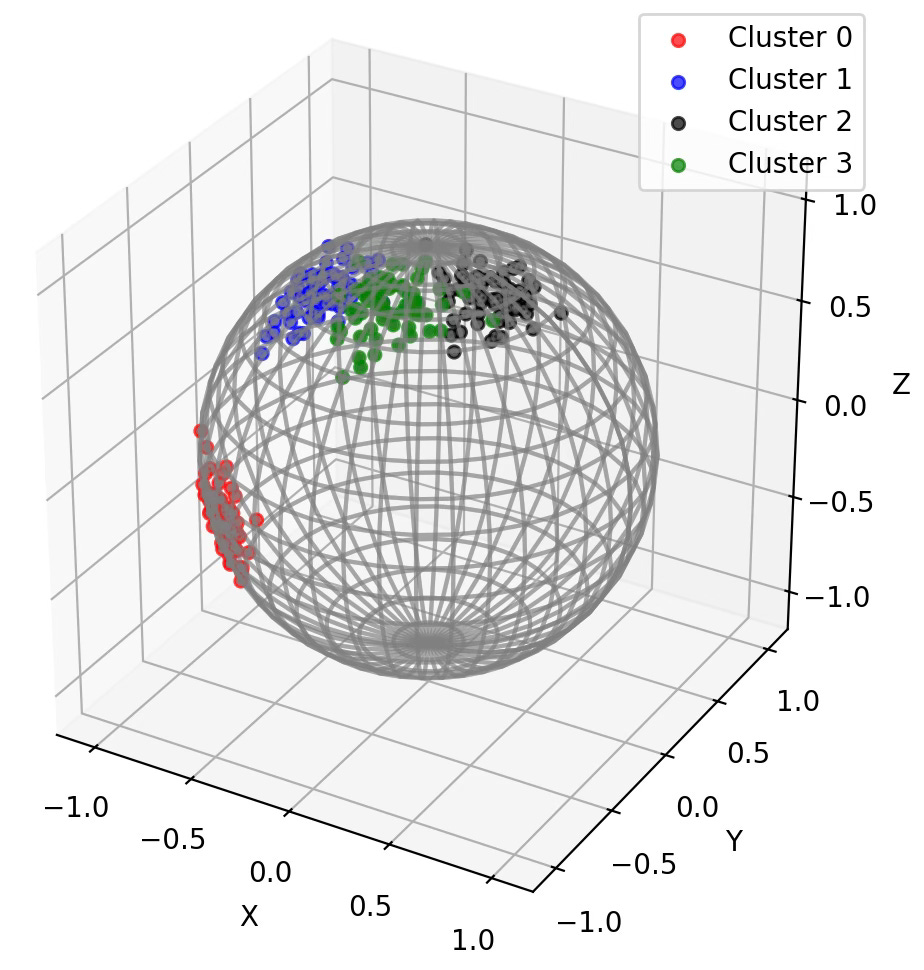
Visualization k-Means clusters on Hypersphere with 64 samples

Visualization k-Means clusters on Hypersphere with 1024 samples
Q5: Can you write Python code to compute the four centroids of data points generated on a hypersphere, using the k-Means class from Scikit-learn?
A5: Here is an example of implementation of k-Means using Scikit-learn library:

Overview of Geomstats for Geometric Learning
Q1: What are the advantages of using a Beta distribution on a manifold?
A1: There are many benefits of applying the Beta distribution on a manifold, among them;
Representation of probability densities over curved spaces
Handling of non Euclidean geometries
Regularization to reduce overfitting
Smooth interpolation of pdf on a manifold
Q2: What is the role of the exponential map in differential geometry?
A2: The exponential map is used to project an end data point onto a manifold given a point of the manifold and a tangent vector. It is also used to compute geodesics.
Q3: Which Geomstats method computes the tangent vector on a manifold, given a base point and a directional vector?
A3: to_tangent which takes a base point on a manifold and vector in Euclidean space
Q4: How does decreasing the number of samples (n_samples) from 6000 to 1000 affect the cross validation on logistic regression on SP3 manifold (code snippet 6)?
A4: Cross validation [0.55 0.525 0.545 0.52 0.525] with mean: 0.533
Q5: Can you implement geodesic computation using the HypersphereMetric geodesic method in Geomstats?
A5: Creating a geodesics consist simply to apply a tangent vector to a sequence base_points of contiguous points on the manifold.
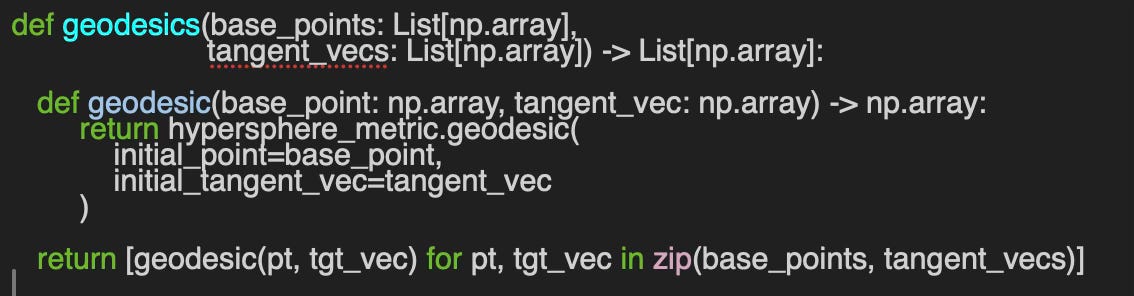
The nested method, geodesic, invoked the Geomstats geodesic method on an instance of the metric class, HypersphereMetric.
Q6: What will be the resulting endpoint on the SO(3) Lie group if the tangent vector represents a 90-degree rotation around the Y-axis?
A6: Executing the code in snippet 7 for a 90-degree rotation around the Y-Axis
Base point:
[[1. 0. 0.]
 [0. 1. 0.]
 [0. 0. 1.]]
Tangent vector:
[[ 0.  0.  1.]
 [ 0.  1.  0.]
 [-1.  0.  0.]]
End point on SO3:
[[ 0.9196  0.0000  0.9972]
 [ 0.0000  2.0000  0.0000]
 [-0.9972  0.0000  0.9196]]
Reusable Neural Blocks in PyTorch & PyG
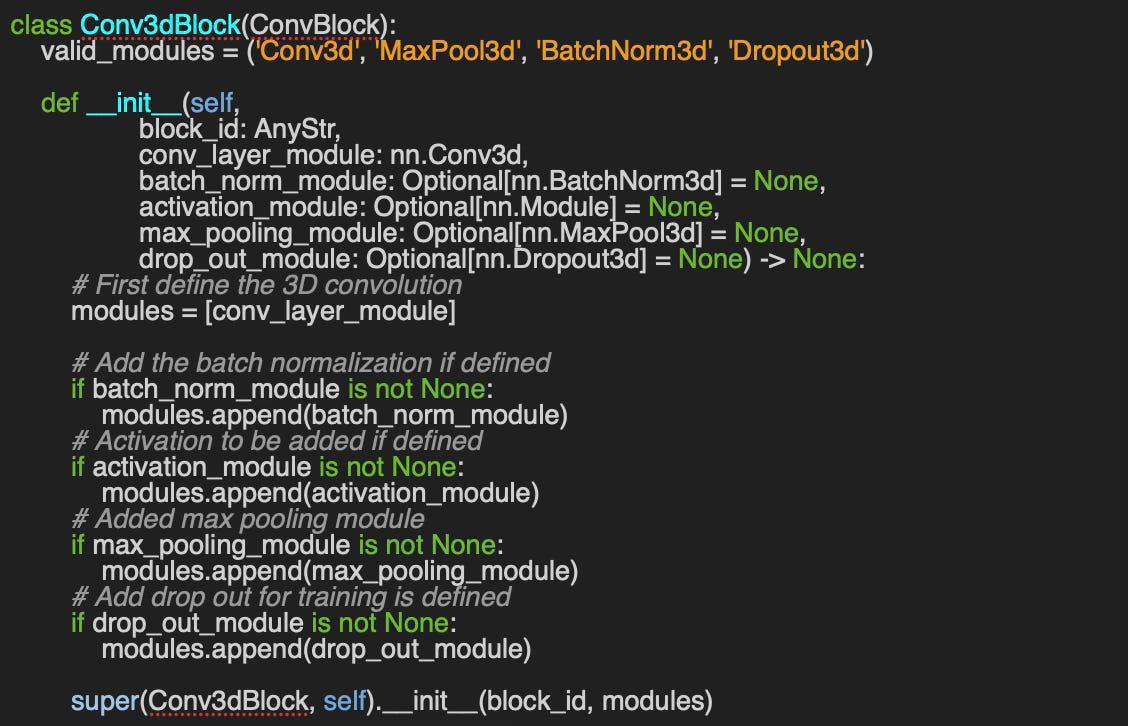
Q1: Can you implement a convolutional neural block for 3D objects?
A1: As expected, the class for 3-dimensional convolutional block, `Conv3dBlock` has a similar structure as its 2-dimension counterpart, `Conv2dBlock`
Q2: The `ConvBlock` class, which defines a generic convolutional neural block, includes an optional dictionary of configuration parameters, `attributes` of type Dict[str, nn.Module]. What is its purpose?
A2: There are two key reasons for incorporating a dictionary of PyTorch convolutional modules:
Ensuring module compatibility with the input data's dimensionality (e.g., an image-based convolutional classifier requires `Conv2d`, `BatchNorm2d`, `MaxPool2d`, and `Dropout2d` modules).
Enabling the automatic creation of corresponding deconvolutional blocks.
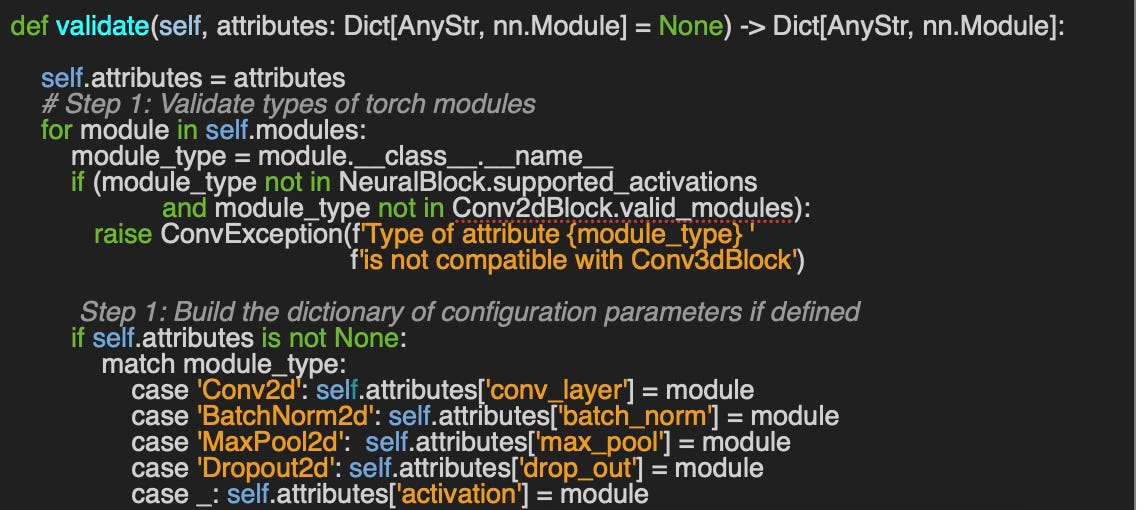
Q3: Can you write a validation method for a convolutional block using the `attributes` dictionary declared in ConvBlock class?
A3: Here is an implementation of the validation of modules for a 2-dimensional convolutional neural block:
Q4: What are the 3 modules of a variational neural block?
A4: The 3 components of the probabilistic latent space are:
Linear module for the mean of the distribution
Linear module for the log of the variance of the distribution
1-dimension shape linear module for sampling the Gaussian distribution
Q5: Which attributes uniquely define a Graph Convolutional Network (GCN) implemented in the `GCNBlock` class?
A5: The minimum set of attributes for a valid Graph Neural Block are
A generic message-passing module from PyTorch Geometric
An optional batch normalization module
A standard PyTorch activation function
A generic graph pooling mechanism
An optional dropout layer for regularization
Modular Deep Learning Models with Neural Blocks
Q1: Can you explain the Builder Pattern?
A1: Well-known to software developers, the Builder Pattern is a creational design pattern that facilitates the step-by-step construction of complex objects. It enables the creation of different representations of an object while maintaining a consistent construction process [ref: Design Patterns: Elements of Reusable Object-Oriented Software - E. Gamma, R. Helm, R. Johnson, J. Vlissides - Addison-Wesley Publishing 1995]
Q2: What is the purpose of transposing a neural network?
A2: The transposition of a neural network aims to automatically generate a mirrored version of its architecture, such as an encoder-decoder pair. This process enables the automatic construction of an Autoencoder using its encoder components.
For example, transposing a set of four 3D convolutional layers results in a corresponding set of four 3D deconvolutional layers.
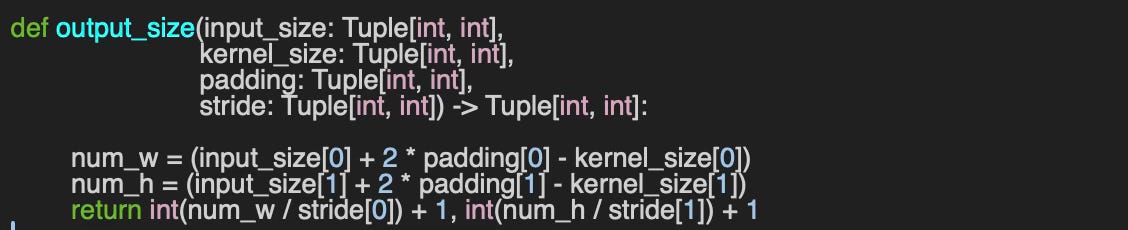
Q3: Can you write a function, output_size, to compute the size of the output of an input of an image from the convolutional block with a kernel_size, padding and stride, given the size, input_size = (w, h) of the input data?
A3: You need to apply the resizing formulas for an image
The implementation is straight forward.
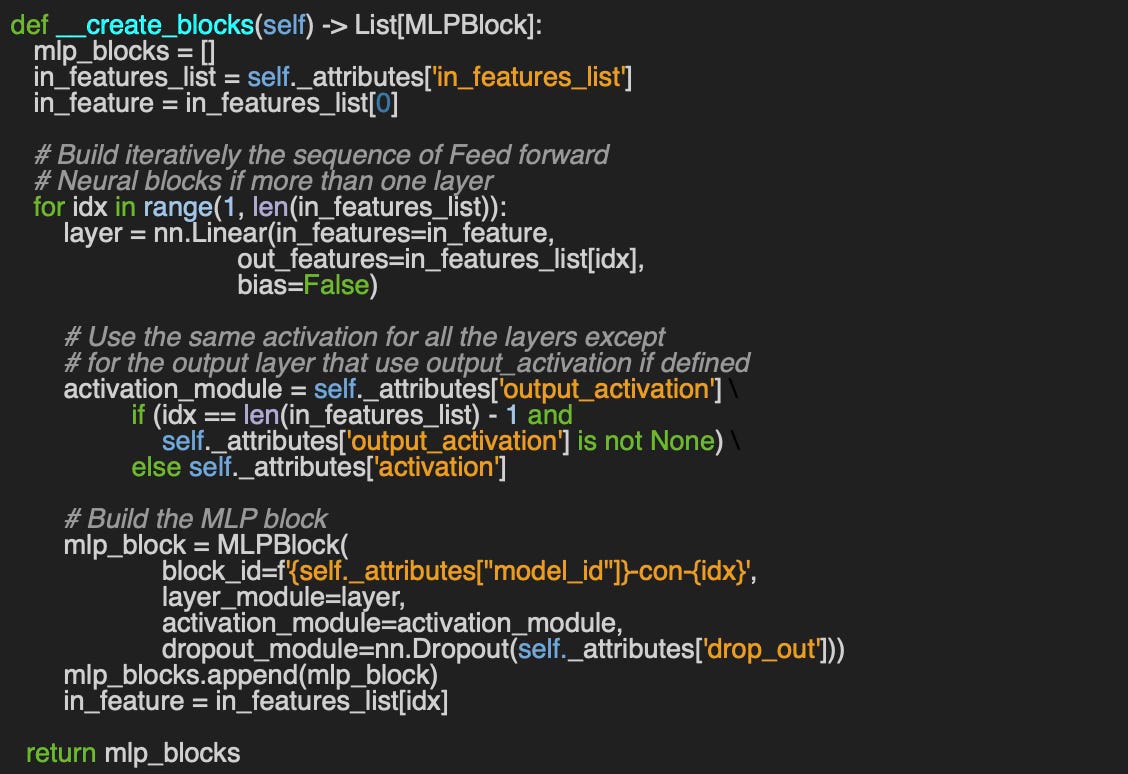
Q4: Can you implement the __create_blocks method for the builder of a Multi-Layer Perceptron MLPBuilder using the dictionary of configuration parameters, attributes, initialized in Code Snippet 4?
A4: Here an example of building a sequence of Multi-Layer Perceptron layers using the dictionary of attributes:
Einstein Summation in Geometric Deep Learning
Q1: What is the difference between implicit and explicit subscripts in Einstein summation notation?
A1:
Q2: Can you rewrite the following operations using NumPy's einsum function, given matrices a and b from Code Snippet 1?
A2:
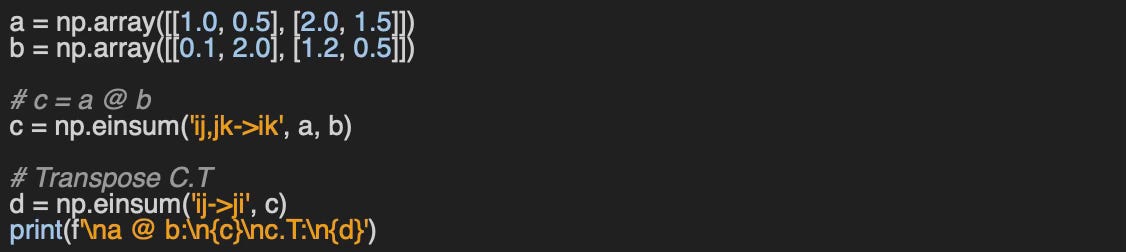
a @ b:
[[0.7  2.25]
 [2.   4.75]]
c.T:
[[0.7  2.  ]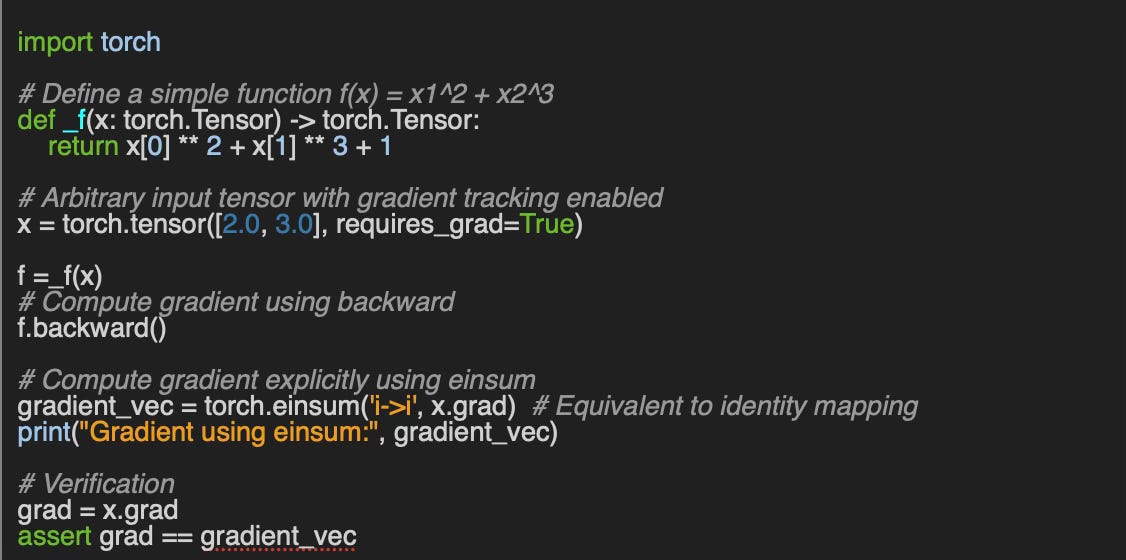
[2.25 4.75]]Q3: Can you use PyTorch's einsum function to compute the gradient of the function:
A3:
Q4: What happens if you attempt to compute the dot product of two vectors of different sizes? (Referencing Code Snippet 3).
A4: Here are few lines of code to capture the error message:
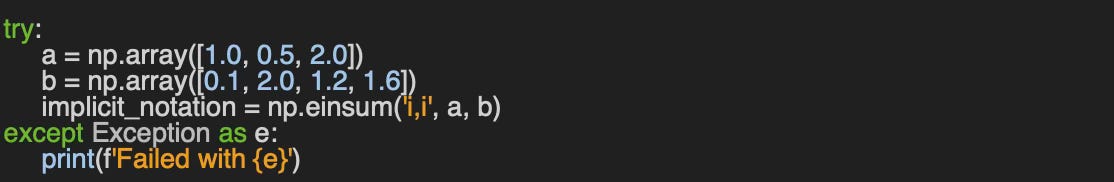
The output is an error message
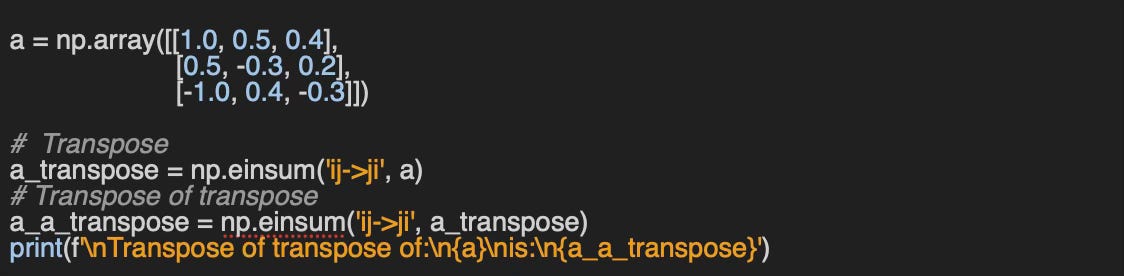
Failed with operands could not be broadcast together with remapped shapes [original->remapped]: (3,)->(3,) (4,)->(4,) Q5: Can you implement a simple validation function to check whether a matrix transpose is correct?
A5: You need to remember that a transpose of a transpose of a matrix is the original matrix.
Taming PyTorch Geometric for Graph Neural Networks
Q1: What does edge_index represent in the context of graph data (type Data)?
A1: The edge_index attribute is a 2-row, multi-column tensor that represents the graph's edge connections in PyTorch Geometric. Each column defines an edge, where:
The first row contains the source nodes.
The second row contains the corresponding target nodes.
It serves as the sparse representation of the adjacency matrix, encoding the connectivity of the graph.
Q2: How can you create a Data instance for the given graph using PyTorch Geometric?
A2:

Q3: What is the role of data.train_mask in graph-based learning?
A3: In PyTorch Geometric, the data.train_mask attribute is a boolean mask used to identify which nodes belong to the training set in node classification tasks.
train_mask[n] = True The nth node in the dataset is used for training
train_mask[n] = False The nth node in the dataset is not used for training
The same logic apply for the data.val_mask filter.
Q4: Between GraphConv and GCNConv, which Graph Convolutional operator offers greater stability?
A4: GCNConv is usually more stable.
Practical Introduction to Lie Groups in Python
Q1: Which field(s) benefit the most from for Lie Geometry?
A1:
Robotics: Invariance in rigid body motion
Molecular research: Equivariance in translation and rotation of molecules
Computer vision: Translation, scaling and rotation tnvariance of frames and images
Q2: What are the two conditions that defines a special orthogonal group?
A2:
Orthogonality of fundamental generators of rotations along X, Y and Z axes
Preservation of rotation and orientation
Q3: What is the size of a SE3 element?
A3: 4 x 4 matrix as follows:
Q4: Can you write a code snippet to compute the SO3 element for a 3x3 matrix representing a unit generator of rotation along Z-axis and infer its corresponding algebra element? Can you verify that the computed algebra element is almost identical to the original matrix?
A4: Here is an example of implementation in Python
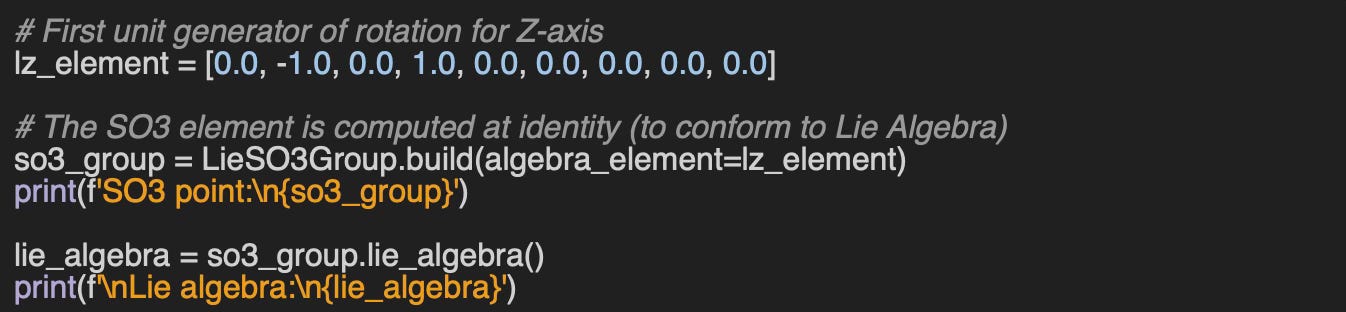
… and its output …
Algebra element:
[[ 0. -1. 0.]
[ 1. 0. 0.]
[ 0. 0. 0.]]
SO3 group element:
[[ 9.19666190e-01 -9.97270378e-01 -3.85335888e-17]
[ 9.97270378e-01 9.19666190e-01 -3.85335888e-17]
[ 0.00000000e+00 0.00000000e+00 1.00000000e+00]]
Lie algebra:
[[-1.62568234e-17 -1.00000000e+00 0.00000000e+00]
[ 1.00000000e+00 -1.62568234e-17 2.15939404e-17]
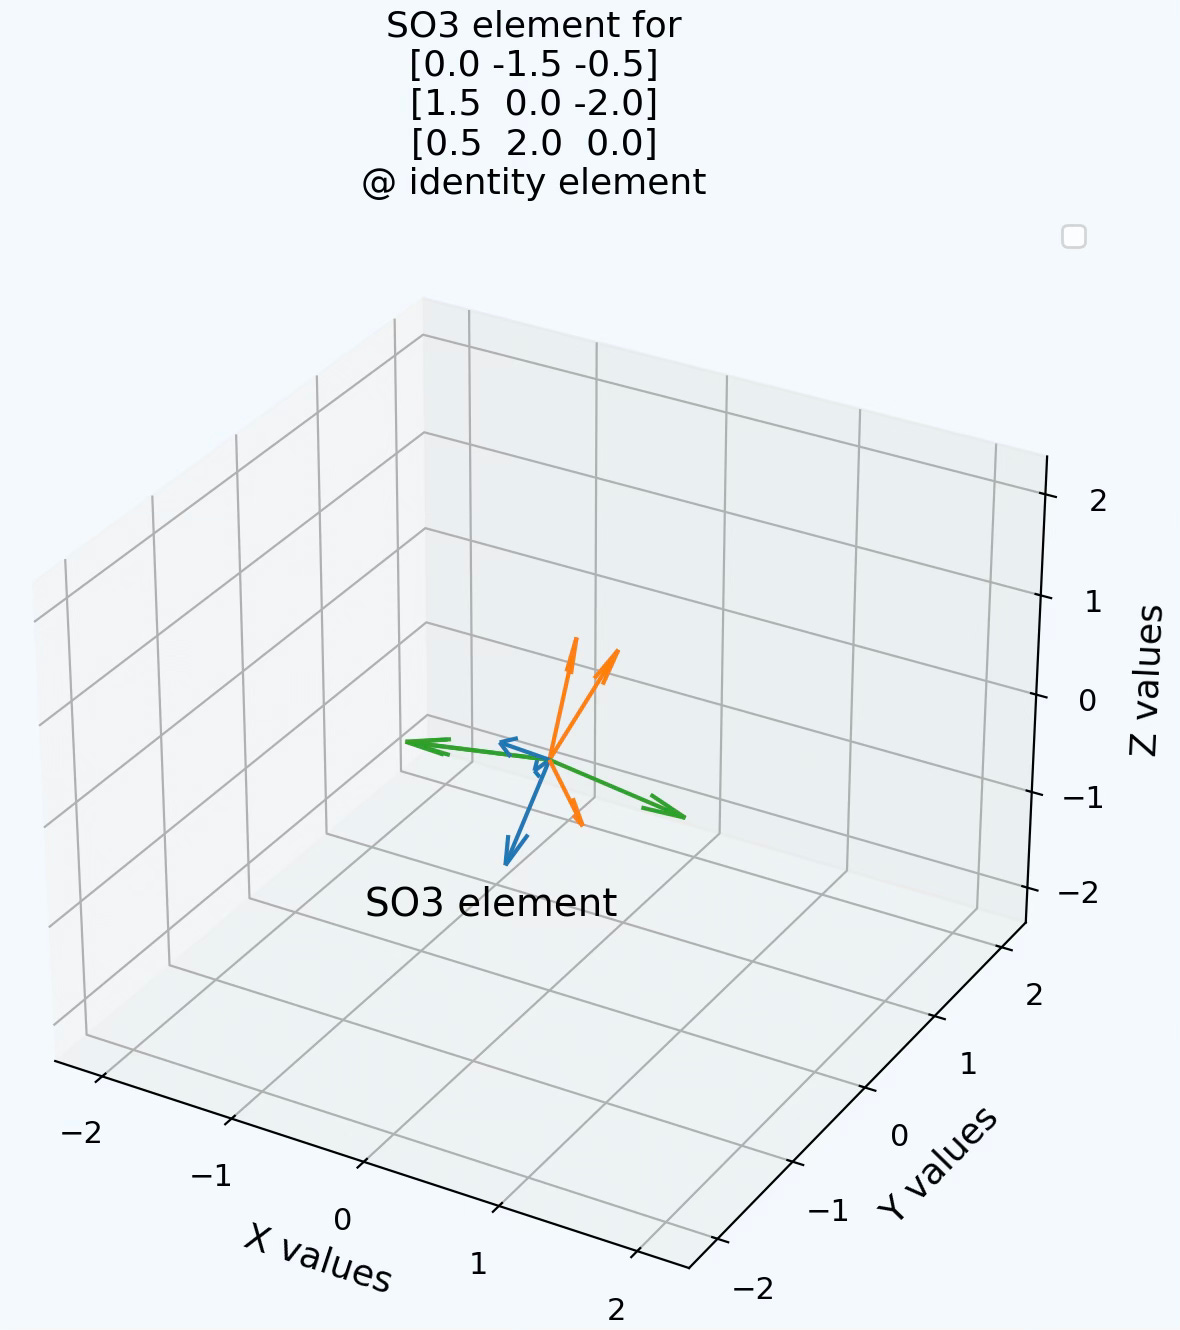
[ 0.00000000e+00 0.00000000e+00 0.00000000e+00]]… and a visualization:
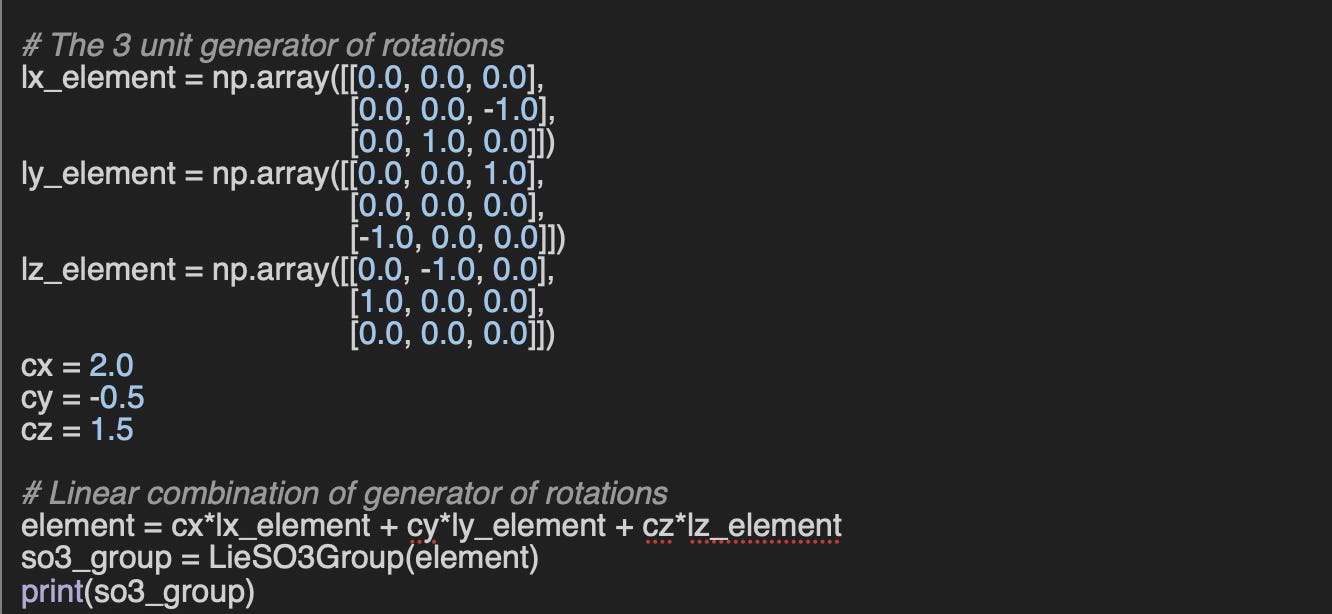
Q5: Can you implement the generation of a SO3 element from a combination of 3 unit generators of rotations along X, Y and Z axes?
A5: An example of linear combination of the 3 fundamental generators of rotation (3x3 matrices).
Demystifying Graph Sampling & Walk Methods
Q1. Is a graph sampling-based inductive learning method conceptually similar to: Breadth-first search (BFS)? Depth-first search (DFS)?
A1: The method for graph sampling-based inductive learning is similar to Depth-first search
Q2. In the context of edge prediction on a graph, what does batch_size represent?
A2: For task related to classification or regression of graph edges, the batch_size is the number of edges contained in a mini-batch
Q3. How can you differentiate between training and validation data when using a neighbor sampling loader?
A3: The training data is specified through the configuration attribute, input_nodes data.train_mask for training data and data.val_mask for validation data. It is common practice to shuffle training data as illustrated below.
 train_loader = NeighborLoader(self.data,
                               num_neighbors=num_neighbors,
                               batch_size=batch_size,
                               replace=replace,
                               drop_last=False,
                               shuffle=True,
                               num_workers=num_workers,
                               input_nodes=self.data.train_mask)
Q4. Which of the following num_neighbors configurations is most suitable for a neighbor sampler: [4, 8, 8], [8, 4, 2], [8, 4, 4, 2]?
A4:
[4, 8, 8] The first hop contains less nodes than the subsequent hops causing instability as it prioritize long-range dependencies.
[8, 4, 4, 2] The 4th hops in the random walk increases the computational cost for training while potentially degrading the performance
[8, 4, 2] Best option, although [8, 4] may result in similar performance for less computational cost
Q5. Can you provide a code snippet to create a neighbor sampling loader for the Facebook dataset using PyTorch, following the structure of Code Snippet #2?
A5:

Plug & Play Training for Graph Convolutional Networks
Q1: What are the advantages of using a declarative format to define training configurations and model parameters?
A1: Some of the benefits …
Reduces the risk of introducing new bugs
Lowers the barrier for data scientists with limited Python programming skills
Eliminates the need to retest existing models and training implementation
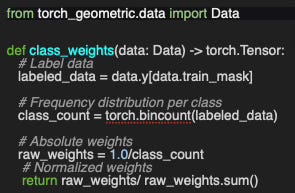
Q2: Can you implement class weight computation to balance classes based on their instance counts, given graph data?
A2: An example of implementation
Q3: Which additional hyper-parameters would you consider adding to the attribute list in Code Snippet 2?
A3:
residual: Use of residual (skip) connections
scheduler: Learning rate scheduler (e.g., cosine, step, plateau)
Q4: What alternative metric would you recommend for evaluating node classification performance on the Flickr dataset?
A4:
Area Under ROC Curve: Measures the trade-off between true positive rate and false positive rate.
Area Under Precision-Recall Curve: Using sensitivity and specificity.
Useful in imbalanced datasets.Average Precision: Area under the precision-recall curve, weighted by recall steps.
Brier Score: Measures the mean squared difference between predicted probabilities and actual outcomes.
Specificity: Measures the ability to correctly identify negatives.
Q5: Can you update the JSON model definition in Code Snippet 10 to include a pooling layer of type TopKPooling?
A5:
{
  'model_id': 'MyModel',
  'gconv_blocks': [
    {
      'block_id': 'G_Conv_1',
      'conv_layer': GraphConv(in_channels=796,
                              out_channels=384),
      'num_channels': 384,
      'activation': nn.ReLU(),
      'batch_norm': None,
      'pooling': TopKPooling(hidden_channels, ratio=0.4),   # Pooling
      'dropout': 0.25
    },
    {
      'block_id': 'G_Block_2',
      'conv_layer': GraphConv(in_channels=384,
                              out_channels=384),
      'num_channels': 384,
      'activation': nn.ReLU(),
      'batch_norm': None,
      'pooling':TopKPooling(hidden_channels, ratio=0.4),   # Pooling
      'dropout': 0.25
    }
  ],
  'mlp_blocks': [
    {
      'block_id': 'MyMLP',
      'in_features': hidden_channels,
      'out_features': _num_classes,
      'activation': nn.LogSoftmax(dim=-1),
      'dropout': 0.0
    }
  ]
}
How to Tune a Graph Convolutional Network
Q1 What are the two main categories of Bayesian Optimization?
A1:
Gaussian Process
Tree-based Parzen Estimator
Q2 Why is the advantage of breaking down the hyperparameter search space into training parameters, model architecture, and node sampling methods?
A2: Breaking down the search space into distinct categories—training parameters, model architecture, and sampling strategies for example - enable to isolate the group of parameters that has the most influence on the performance of the model, making the process more manageable.
Q3 Can you implement an __init_hpo method (referenced as code snippet 3) for the Graph Sampling Based Inductive Learning Method [ref 2]? As a reminder, the JSON string describing the sampling parameters is:
{
  'id': 'GraphSAINTRandomWalkSampler',
  'walk_length':3,
  'num_steps': 12,
  'sample_coverage': 100,
  'batch_size': 4096,
  'num_workers': 4
}A3: Here is an example of implementation of __init_hpo
Q4 Can you modify the objective method (referenced as code snippet 2) so that it minimizes the validation loss?
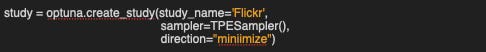
A4:
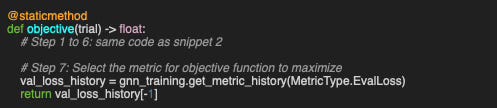
You also need to modify the direction of the study:
Q5: Can you name one limitation of the Optuna hyperparameter optimization library?
A5: There are 2 known limitations
The list of categorical values supported in Optuna is limited to discrete scalar values such as strings, numbers, or simple objects.
objective function has to be implemented as either a global or class (static) method.
Designing Graph Neural Networks from Homophily Ratios
Q1: What distinguishes the node homophily ratio from the edge homophily ratio?
A1:
Edge homophily ratio: The fraction of edges in a graph which connects nodes that have the same class label. It answers the question, How likely is it that a random edge connects same-label nodes?
Node homophily ratio: Edge homophily is normalized across neighborhoods. It answers, How homophilic is the neighborhood of a typical node?
Q2: What are the key attributes that define the complexity of a Graph Neural Network?
A2: Here is a few attributes:
Number of graph convolutional and attention layers
Graph pooling layer
Node or edge neighbor sampling method
Residual connections
Heteromophilic nodes
Inclusion of isolated nodes
Aggregation method
Data transformation prior aggregation
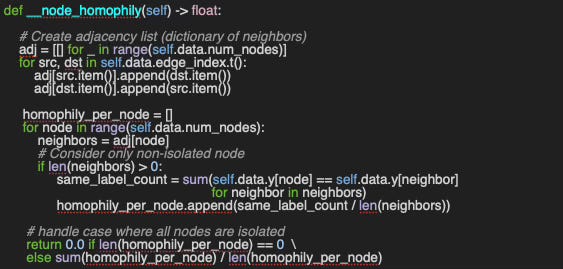
Q3: How can the node homophily ratio be implemented in code?
A3: Here is an example of computation of the node homophily ratio
Q4: What factors contribute to the discrepancy between node and edge homophily ratios?
A4: Actually there are several factors, among them,
Edge homophily tends to be biased toward high-degree nodes
Node homophily typically excludes isolated nodes
Edge homophily is overstated in case of class imbalance (one class contains most of high degree nodes)
You may find additional factors in technical literature and research papers
SE(3): The Lie Group That Moves the World
Q1: What are the two point types used in SE(3)?
A1: SE(3) is both a Lie group structure and a smooth manifold. Therefore, the two point types are ‘matrix’ for Lie algebra and ‘vector’ for operation of the smooth manifold
Q2: The exponential map generates SE(3) elements from a 4×4 Lie algebra matrix. How can we compute the corresponding Lie algebra matrix from a given SE(3) element?
A2: Logarithm map
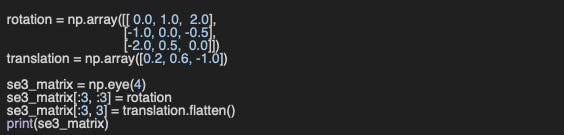
Q3: Can you provide Python code, using numpy to construct a 4×4 SE(3) matrix from a given 3×3 spatial rotation matrix and a 3D translation vector?
A3:
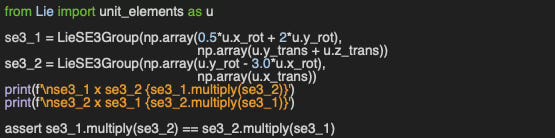
Q4: Additionally, can you provide code to verify SE(3) multiplication is not commutative?
A4:
Geometry of Closed-form Statistical Manifolds
Q1: What is the shape of tensor representing a point on a statistical manifold defined by n parameters?
A1: The shape of the tensor is the same after the number of parameters. For instance exponential distribution has one parameter, rate so the tensor has one value. The shape of a point on the normal distribution manifold would have to components.
Q2: What is the Fisher information metric of the normal distribution when the standard deviation is fixed and not treated as a parameter?
A2: Using the formula [B} on the Normal distribution N(μ,σ2) the metric is
Q3: Can you implement the Fisher information metric for a normal distribution with a constant, fixed standard deviation?
A3:
Q4: Can you compute the Fisher-Rao metric manually for the exponential distribution manifold?
A4:
Shape Your Models with The Fisher-Rao Metric
Q1: What are the most commonly used numerical integration techniques to compute exponential or logarithm maps of complex statistical manifolds without closed-form?
A1: Complex, high dimensional statistical manifolds have to rely on numerical ODE solvers such as finite difference (i.g., Runge-Kutta), Geodesic solver (shooting or Path-based) and Interpolators.
Q2: Can you derive the Fisher distance for the Poisson distribution from its Fisher information metric?
A2: Given the Fisher metric
The steps are
The condition of symmetry assume that the integration points are interchangeable. Therefore,
Q3: Can you compute step by step the Fisher information for the Geometric Distribution.
A3: The probability density function for the Geometric distribution is:
The Riemann metric is computes as
Mastering Lie Rotation Groups With Practice
Q1: What are the two criteria that determine whether a matrix belongs to the Special Orthogonal Group SO(n)?
A1: Enforces orthogonally for which the unit of rotations are mutually perpendicular. It is equivalent to O(n) group.
Ensures rotation and preserves orientation.
Q2: What is the rotation matrix on SO(2) group for the following skew symmetric matrix on so2 Algebra?
A2: The rotation matrix is computed using the exponential map as
Q3: Given the rotation matrix:
What is its inverse?
A3: Inverse
Q4: Can you verify that multiplying an SO(3) rotation matrix by its inverse yields the identity matrix?
A4: Source code example
A=tensor([[ 0., -1.,  0.],
          [ 0.,  0.,  1.],
          [-1.,  0.,  0.]])
A o inv(A)=tensor([[1., 0., 0.],
                   [0., 1., 0.],
                   [0., 0., 1.]])
A Journey into the Lie group SO(4)
Q1: For two elements A and B in the Lie algebra so(4) (represented as 4×4 skew-symmetric matrices), under what condition does the following equality hold?
A1: The multiplication of the two 4 x 4 skew-symmetric matrices an and b is commutative. which is not usually the case. The condition can be restated using the Lie bracket.
Q2: is Rodrigues’s rotation formula applicable to the Lie algebra so(4)?
A2: No, the Rodrigues's Formula, does not directly apply to Lie algebras so(n) for n > 3. It is a closed-form expression for the exponential of a skew-symmetric matrix for the Lie algebra so(3) which is isomorphic to 3-dimensional Euclidean space.
Q3: Why is the purpose to project a matrix onto the SO(n) manifold?
A3: The purpose is to find a SO(n) rotation matrix which is closest (similar) to the original matrix
Q4: Can you implement the code to confirm that the composition of two rotation matrices in SO(4) is generally not commutative?
A4: Here is an example
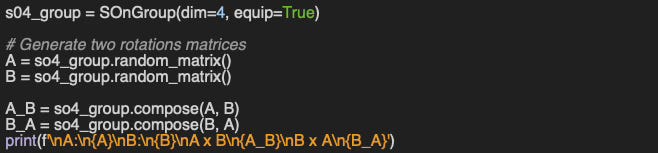
A:
tensor([[ 0.5413,  0.6407, -0.4444, -0.3146],
        [ 0.4234, -0.3577,  0.4809, -0.6794],
        [ 0.6838, -0.4638, -0.2067,  0.5241],
        [ 0.2452,  0.4965,  0.7270,  0.4061]])
B:
tensor([[ 0.5084,  0.4607, -0.6652, -0.2946],
        [ 0.5776, -0.4568,  0.3746, -0.5634],
        [ 0.0885, -0.7458, -0.5847,  0.3067],
        [ 0.6325,  0.1512,  0.2745,  0.7083]])

A x B:
tensor([[ 0.4070,  0.2406,  0.0534, -0.8796],
        [-0.3784, -0.1029, -0.8833, -0.2569],
        [ 0.3930,  0.7603, -0.3639,  0.3677],
        [ 0.7326, -0.5946, -0.2908,  0.1586]])
B x A
tensor([[-0.0568,  0.3232, -0.0811, -0.9411],
        [ 0.2372,  0.0800, -0.9634,  0.0962],
        [-0.5925,  0.7469, -0.0542,  0.2969],
        [ 0.7678,  0.5755,  0.2498,  0.1298]])
From Nodes to Complexes: A Guide to Topological Deep Learning
Q1: What additional inputs does a topological neural model require beyond the features extracted from the input data?
A1: The list includes Persistent Homology, Betti numbers, shape analysis (holes, voids)
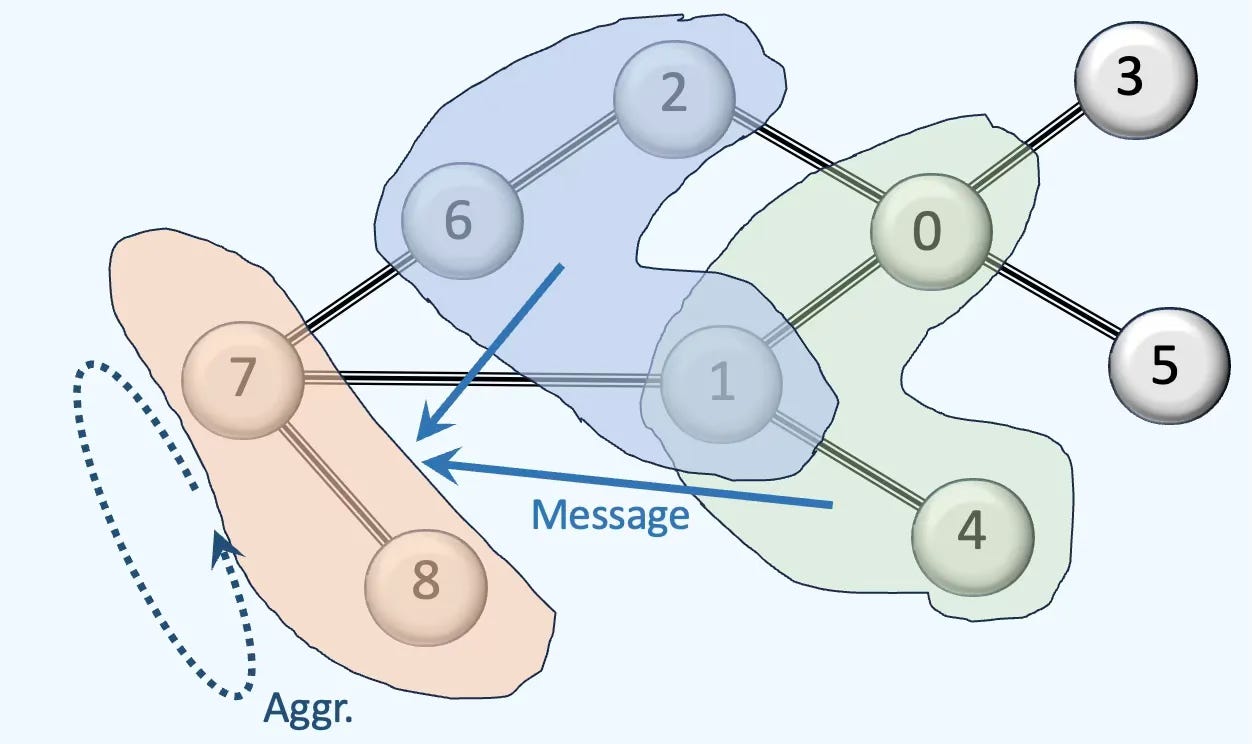
Q2: How does message aggregation in Topological Deep Learning (TDL) differ from that in Graph Neural Networks (GNNs)?
A2: While Graph Neural Networks have a single type of aggregation (or summation) function, TDL has
Intra-neighborhood aggregation
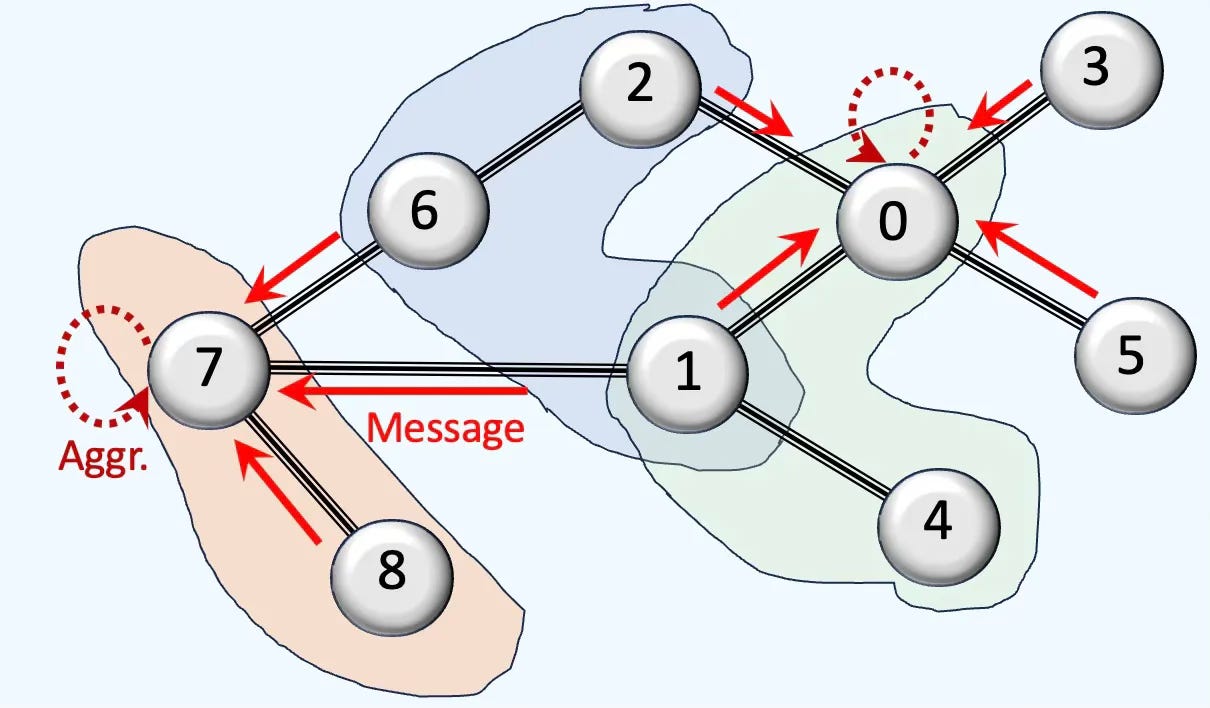
Inter-neighborhood aggregation
Q3: Which topological domains are most commonly used in Topological Data Analysis (TDA) and Topological Deep Learning (TDL)?
A3: The list includes
Undirected graphs
Simplicial Complexes
Cell Complexes
Combinatorial Complexes
Hypergraphs
Q4: In what way does TDL differ from Geometric Deep Learning (GDL) with respect to transformation invariance?
A4: GDL elements such as Lie groups or Manifolds supports invariance and/or equivariance for transformation such as rotation, translation or scaling. TDL deals with invariance during continuous deformation
Q5: What do Betti numbers quantify in a topological space?
A5: Betti numbers provide a concise summary of the space's shape and structure, especially when dealing with high-dimensional or complex datasets (dimension 0: Connected components, dimension 1: holes, loops, dimension 2: 3D holes and voids,)
Q6: How do adjacency and incidence matrices differ in representing graph or topological structures?
A6: Adjacency matrix define the edges between indexed nodes. Incidence matrix represents the faces between indexes nodes and indexed edges.
Exploring Simplicial Complexes for Deep Learning: Concepts & Code
Q1: Does the Down-Laplacian exist for rank-0 simplices? If so, what is its interpretation?
A1: No Down-Laplacian of rank-0 does not exist. Although you can project a face to its boundaries (edges) for rank 2 and edges to nodes for rank 1, you cannot project nodes.
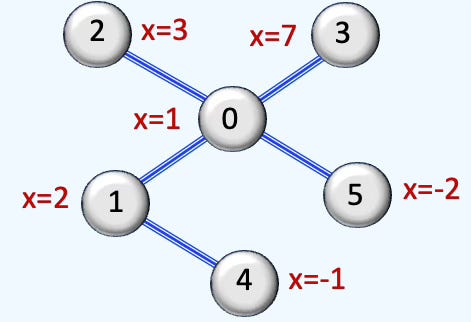
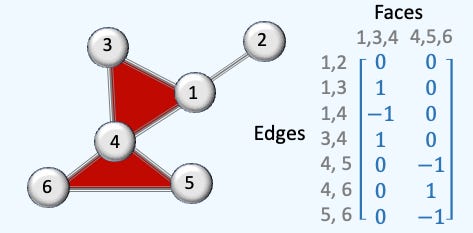
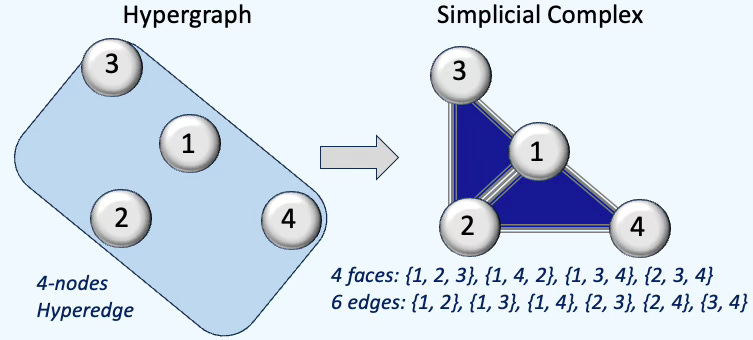
Q2: What is the rank-2 incidence matrix for the given simplicial complex?
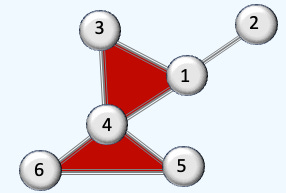
A2: The graph has 7 edges and 2 faces so the incidence matrix of rank 2 has 7 x 2 dimension as follows
Q3: How is the Hodge Laplacian computed from the Up- and Down-Laplacians?
A3: Simply as the sum of the Up-Laplacian and Down-Laplacian
Q4: How many different ranks (dimensions) can a Hodge Laplacian be defined for in a simplicial complex?
A4: 3, rank 0 and 1 from Up-Laplacian and rank 1 and 2 from Down-Laplacian
Q5: What are the key differences between signed and unsigned Laplacians?
A5: Signed Laplacians take into the orientation of edges associated with faces and encode both the structure of the simplex but also its orientation. Unsigned Laplacians encode only the structure of the simplicial complex.
Q6: How does the ordering of edge indices influence the computation of the Laplacians?
A6: The ordering of edge indices has no impact on the computation of Laplacians.
Revisiting Inductive GNNs: GraphSAGE
Q1: Does increasing the hop count in neighbor sampling improve node-classification performance?
A1: Not always. A large fan-in (large number of nodes and number of hops > 2) of message aggregation may decrease the performance of the classification of nodes.
Q2: What is the rationale for randomly sampling a subgraph from a large graph for node classification?
A2: While not without pitfalls, subgraph extraction from a large graph shortens node-classifier training. However it is important to take into consideration the node and edge homophily in selecting the size of the subgraph
Q3: How does adding more GraphSAGE convolutional layers affect node-classification performance?
A3: Adding layers can improve node classification, but gains on small graphs are modest; more than three layers are rarely necessary
Q4: What challenges arise when extracting random subgraphs from large graphs, and how do they impact classifier performance?
A4:
Sampling may distort edge-homophily, changing the fraction of same-label edges.
A significant percentage of nodes lie at the subgraph’s edge with truncated neighborhoods, downgrading the quality of aggregation.
Hubs may be over/under-represented affecting the neighborhood statistics.
Larger subgraphs with deeper/higher-hop aggregation blur features more than on the full graph.
Labels associated with the subgraph may have a different distribution that the entire graph
Sampling may alter degree, means or variances.
Q5: Beyond layer depth and neighborhood sampling, which other model or training parameters most influence GraphSAGE performance?
A5: Activation function of the SAGE convolutional block, Batch normalization.
Topological Lifting of Graph Neural Networks
Q1: Which class in the TopoNetX library represents simplicial complexes?
A1: tnx.SimplicialComplex Ref: toponetx.simplicial_complex
Q2: What are Hodge–Laplacians?
A2: The Hodge Laplacian was introduced in article Exploring Simplicial Complexes for Deep Learning
The Hodge Laplacian for simplicial complexes is a generalization of the graph Laplacian to higher-order structures like triangles, tetrahedra, etc. It plays a central role in topological signal processing, Topological Deep Learning, and Hodge theory. It is the sum of Down-Laplacian that quantifies how k-simplex is influence by its lower-dimensional faces and Up-Laplacian that reflects how k-simplices are stitched together into higher-dimensional structures.
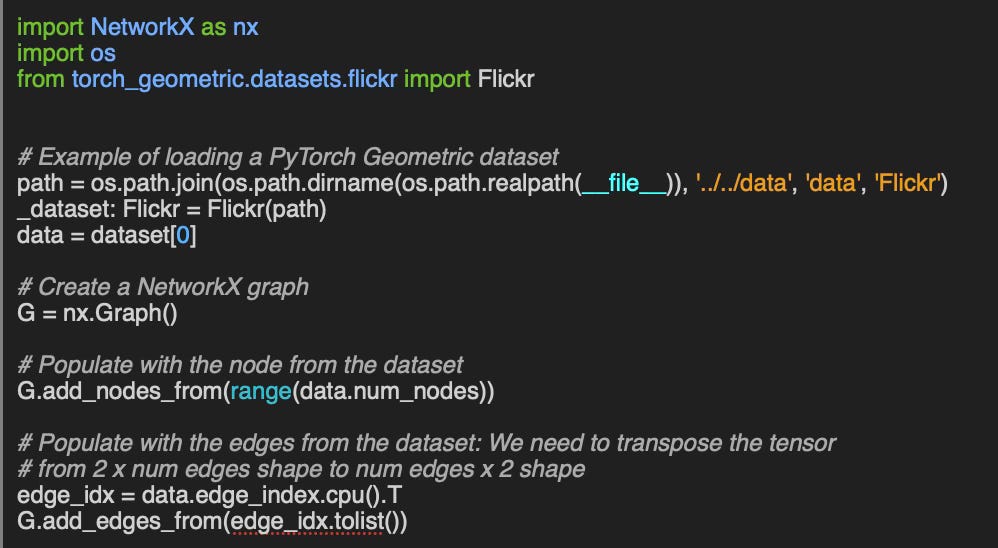
Q3: Could you show an example of constructing a NetworkX graph from a PyTorch Geometric dataset?
A3: Let’s take the example of PyTorch Geometric Flickr dataset.
Q4: Compared to a clique-based lifting, does a neighborhood-based lifting typically produce a higher-dimensional simplicial complex (i.e., more or higher-order simplices)?
A4: The neighborhood-based lifting take into account all neighbors of every node, resulting in larger number of elements at a much higher computational cost that cliques.
Example: KarateClub dataset
Simplicial Complex shape=(34, 78, 45), dimension=2

Simplicial Complex shape=(34, 343, 1787, 6106, 15852, 32322, 52610, 69061, 73489, 63438, 44267, 24764, 10949, 3740, 952, 170, 19, 1), dimension=17
Graph Convolutional or SAGE Networks? Shootout
Q1: What are the key differences between transductive and inductive graphs?
A1: Inductive models train during inference on new and unseen nodes. They are more appropriate for graph which features changes overtime with customizable, learnable message aggregation. They perform better in low-homophily and are scalable.
Transductive models train on the entire graph dataset making them less suitable with very large graph with low homophily.
Q2: For low-homophily graphs, which GNN is more suitable—GCN or GraphSAGE?
A2: Because of their dynamic nature (training on run-time data), GraphSAGE networks perform better in low homophily graph nodes than GCN.
Q3: Do hyper-parameters like learning rate or number of epochs affect the relative comparison between two GNNs?
A3: Everything being equal, traditional hyper-parameters have limited impact in comparing models as long as identical values are applied during training of these models.
Q4: Which evaluation metrics are best for comparing two models?
A4: We do not make any assumption on the classification or prediction task used in evaluating the models. Therefore it is prudent to use as many performance metrics as possible - in our evaluation - Precision, Recall, F1, Accuracy, Area under ROC curve and Precision/Recall curve
Q5: On large graphs, does GCN outperform GraphSAGE?
A5: No. GraphSAGE networks are significantly more performant as the size of the graph dataset increases. The results of our evaluation confirm this well-known finding.
Q6: How does increasing the number of neighbors and fanout for message aggregation influence the comparison between GraphSAGE and GCN?
A6: We found out that increasing the scope of neighborhood for message aggregation advantages somewhat GraphSAGE networks.
Graphs Reimagined: The Power of Cell Complexes
Q1: How does the computation of Laplacians differ between Cell Complexes and Simplicial Complexes?
A1: Simplicial and cell complexes differ for cell or simplex of rank 2 and above. These two complexes represent relationships and orientations among cells differently as the computation of their respective incidence matrices.
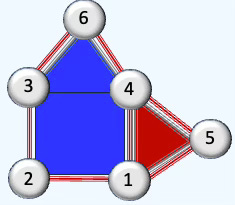
Q2: What distinguishes Adjacency from Co-adjacency in topological complexes?
A2: Adjacency can be defined as a relation between cells of the same dimension that shared a lower-dimension boundary. Coadjacency defines the relation between cells of the same dimension that share the next higher-dimensional co-boundary
Q3: What two conditions must a cell complex satisfy to qualify as a CW complex?
A3:
C: Closure-Finiteness: Closure of each cell intersects only finitely many other cells.
W Weak Topology: A subset is closed if its intersection with the closure of every cell is closed.
Q4: How can the adjacency matrix for rank-2 cells be implemented in Python using TopoNetX?
A4: Here is a code snippet using toponetx.cell_complex.py
 cc = tnx.CellComplex(cells, signed=signed)
 return cc.adjacency_matrix(rank=2, signed=signed)
Q5: What is the rank-1 Hodge Laplacian for the given cell complex?
A5:
Hodge Laplacian Rank 1:
[[ 3.  0.  1.  0.  1.  0. -1.]
 [ 0.  4.  0. -1. -1.  0.  0.]
 [ 1.  0.  3.  0.  0.  0.  0.]
 [ 0. -1.  0.  3.  0.  0. -1.]
 [ 1. -1.  0.  0.  3.  0.  0.]
 [ 0.  0.  0.  0.  0.  3.  1.]
 [-1.  0.  0. -1.  0.  1.  3.]]
Exploring Hypergraphs with TopoX Library
Q1: What is the key difference between a hypergraph and a graph?
A1: Edge in a directed or undirected graph is restricted to a pair of nodes/vertices. Hypergraph allow an hyperedge to connect to more than 2 nodes.
Q2: Can you name three different types of hypergraphs?
A2: There are many types of hypergraphs from simple, k-Uniform, k-Partite, directed, weighted, d-Regular to colored.
Q3: What is the key step required to compute the Up, Down, and Hodge Laplacians of a hypergraph?
A3: The hypergraph has to be converted into a simplicial complex as Laplacian are extractable from simplices of rank 0. 1 and 2 only.
Q4: How is a square-shaped hyperedge transformed when a hypergraph is converted into a simplicial complex?
A4: The square-shaped hyperedge has to be a combination of 4 triangles as illustrated below:
Q5: What is the role of the simplicial_complex_dict dictionary in code snippet 5?
A5: This member variable of the FeaturedHyperGraph class serves as a placeholder that stores all edges and faces generated during the hypergraph-to–simplicial complex conversion. These elements are needed for computing the various Laplacian matrices.
Understanding Data Through Persistence Diagrams
Q1: What role do persistence images play in topological data analysis?
A1: The gridded numerical images (birth - persistence) can be used as feature vector of any machine learning model.
Q2: How is persistence computed?
A2: persistence = deaths - births
Q3: How does noise affect persistence landscapes?
A3: The lambdas function (or “tents”) are more evenly distributed as illustrated with the Torus-shaped noisy data.
Q4: How the noise is reflected in a birth–death (persistence) diagram?
A4: Noise point (birth, death) are accumulated along the diagonal.
Q5: What does the persistence image of a uniformly random dataset look like?
A5: It should be a uniform color with very low intensity
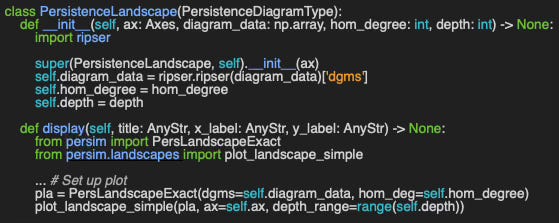
Q5: Can you implement a subclass of PersistenceDiagramType defined in Appendix to visualize persistence landscapes - using ripser and persim packages?
A5:
Superb. Thank you.